

Newsroom
Sorted by: Latest
-
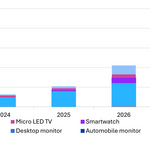
Omdia: Micro LED Display Revenue to Double to $105 Million in 2026 Driven by Near-Eye Smart Watch and Public Display Applications
LONDON--(BUSINESS WIRE)--Micro LED display revenue is projected to grow 100% year-over-year (YoY), increasing from $52.4 million in 2025 to $105.4 million in 2026, according to the Omdia Micro LED Display Market Tracker. While Micro LED displays for public display, ultra-large TVs, smart watches, and smart glasses remain limited, rapidly maturing manufacturing capabilities and new product adoption are expected to drive significant shipment and revenue growth in the near term. Until recently, la...
-
Star Mountain Capital Announces Final Close of Its Oversubscribed 2nd SBIC Fund at a Program Optimized Level of $286 Million
NEW YORK--(BUSINESS WIRE)--Star Mountain Capital, LLC (Star Mountain), a rapidly growing, employee-owned U.S. lower middle-market investment firm with approximately $4.5 billion in assets under management (AUM), is pleased to announce that it closed its second SBIC fund above its target at $286 million of investible capital, which is a fund size that optimizes the maximum amount of SBA debentures accessible for investors. As part of the Small Business Investment Company (SBIC) program, SBIC Fun...
-
Vonage Expands Developer Ecosystem to Accelerate the Next Era of Enterprise Digital Transformation
HOLMDEL, N.J.--(BUSINESS WIRE)--Vonage, part of Ericsson (NASDAQ: ERIC), today announced a number of new initiatives, to further expand and enable its global developer community. By growing its developer community and tools, giving developers and enterprises access to new mobile network insights and capabilities that can be embedded into existing applications and workflows, Vonage is accelerating its strategy to transform mobile networks into a programmable platform. Putting Vonage APIs in the...

-
RWS Secures US Patent for AI That Predicts Translation Effort at the Point of Authoring
MAIDENHEAD, England--(BUSINESS WIRE)--RWS (RWS.L), a global AI solutions company, has been awarded US Patent No. 12,505,297 for an AI-powered system that enables organizations to understand the translation potential of their content as it is being authored – long before a translation project is scoped or commissioned. Coming to Trados customers in 2026, the patented technology – Document Translation Feasibility Analysis Systems and Methods – analyzes a source document to identify how much conte...
-
OBUSPA Integrated with prpl and RDK
FREMONT, Calif.--(BUSINESS WIRE)--There has been a revolutionary shift in how quickly broadband service providers (BSPs) using prpl Foundation and RDK platforms can deploy new services, from months and years to a matter of weeks, as both organizations have integrations with the Broadband Forum’s OBUSPA open source software. Two of the most widely used carrier-grade open source platforms for home broadband management, prpl Foundation’s prplWare and RDK’s RDK-B software, have integrated the Open...

-
Rudding Park Selects Agilysys Hospitality Software Solutions to Modernise Guest Journeys and Streamline Operations Across Its Hotel Ecosystem
LONDON & ALPHARETTA, Ga.--(BUSINESS WIRE)--Agilysys, Inc. (Nasdaq: AGYS), a leading global provider of hospitality technology solutions, today announced that Rudding Park - an award-winning hotel, spa, and golf resort in Harrogate - has appointed Agilysys hospitality software solutions to support a large-scale technology transformation across its growing, multi-amenity luxury hotel business. From Single Hotel to Complex Luxury Destination Over nearly two decades, Rudding Park has evolved from a...
-
Marathon Asset Management Ltd UK Regulatory Announcement: Form 8.3
LONDON--(BUSINESS WIRE)-- FORM 8.3 PUBLIC OPENING POSITION DISCLOSURE/DEALING DISCLOSURE BY A PERSON WITH INTERESTS IN RELEVANT SECURITIES REPRESENTING 1% OR MORE Rule 8.3 of the Takeover Code (the “Code”) 1. KEY INFORMATION (a) Full name of discloser: Marathon Asset Management Limited (b) Owner or controller of interests and short positions disclosed, if different from 1(a): The naming of nominee or vehicle companies is insufficient. For a trust, the trustee(s), settlor and beneficiaries must...
-
Computershare Trustees (Jersey) Limited UK Regulatory Announcement: Form 8.3
LONDON--(BUSINESS WIRE)-- FORM 8.3 PUBLIC OPENING POSITION DISCLOSURE/DEALING DISCLOSURE BY A PERSON WITH INTERESTS IN RELEVANT SECURITIES REPRESENTING 1% OR MORE Rule 8.3 of the Takeover Code (the “Code”) 1. KEY INFORMATION (a) Full name of discloser: Computershare Trustees (Jersey) Limited as trustee of the Schroders Employee Benefit Trust (b) Owner or controller of interests and short positions disclosed, if different from 1(a): The naming of nominee or vehicle companies is insufficient. Fo...
-
Everbridge xMatters to Host London Event on the Future of Incident Management
LONDON--(BUSINESS WIRE)--Everbridge, Inc., the global leader in High Velocity Critical Event Management (CEM) and national public warning solutions, will host an exclusive customer event on March 17 at the Churchill War Rooms in London, bringing together IT, DevOps, and operational leaders to discuss the evolving demands of modern incident management and operational resilience. Titled “The Future of Incident Management: A Blueprint for Operational Excellence,” the half-day program will feature...

-
Natixis Syndicate UK Regulatory Announcement: Pre-stabilisation Announcement
LONDON--(BUSINESS WIRE)-- PRE-STABILISATION ANNOUNCEMENT Date: 19 February 2026 Not for distribution, directly or indirectly, in or into the United States or any jurisdiction in which such distribution would be unlawful. BPCE SA Pre-stabilisation Period Announcement Natixis (contact: Christopher Agathangelou; telephone: 0158550814) hereby gives notice, as Stabilisation Coordinator, that the Stabilisation Manager(s) named below may stabilise the offer of the following securities in accordance w...