Newsroom
Sorted by: Latest
-
First Trust Global Funds PLC UK Regulatory Announcement: Net Asset Value(s)
LONDON--(BUSINESS WIRE)-- Funds Date TIDM ISIN Code Shares in Issue Currency Net Asset Value NAV/per Share First Trust Nasdaq Clean Edge Smart Grid Infrastructure UCITS ETF 23.06.2026 GRDU.LN IE000J80JTL1 40,750,002.00 USD 2,672,090,716.57 65.573 ...
-
First Trust Global Funds PLC UK Regulatory Announcement: Net Asset Value(s)
LONDON--(BUSINESS WIRE)-- Funds Date TIDM ISIN Code Shares in Issue Currency Net Asset Value NAV/per Share First Trust Alerian Disruptive Technology Real Estate UCITS ETF 23.06.2026 LANDXEN.LN IE000C75IMX8 15,878.00 USD 315,990.40 19.901 ...
-
First Trust Global Funds PLC UK Regulatory Announcement: Net Asset Value(s)
LONDON--(BUSINESS WIRE)-- Funds Date TIDM ISIN Code Shares in Issue Currency Net Asset Value NAV/per Share First Trust Alerian Disruptive Technology Real Estate UCITS ETF 23.06.2026 LANDXN.LN IE000RN036E0 34,035.00 USD 742,453.88 21.814 ...
-
VENU Hosts Intimate FireSuite Investor Event in McKinney, Texas Featuring Three-Time Super Bowl Champion and VENU Shareholder Troy Aikman
COLORADO SPRINGS, Colo.--(BUSINESS WIRE)--Venu Holding Corporation ("VENU" or the "Company") (NYSE AMERICAN: VENU), an owner, operator, and developer of premium live entertainment destinations, today announced that it hosted a private investor event just north of Dallas, in McKinney, Texas, featuring NFL Hall of Famer, three-time Super Bowl Champion, national spokesperson, and VENU® shareholder Troy Aikman.The event took place this past Monday, June 22nd, near the future site of VENU's Sunset Am...

-
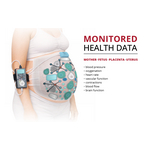
Carnegie Mellon Team Awarded ARPA-H Contract to Transform Care During Labor and Childbirth
PITTSBURGH--(BUSINESS WIRE)--Carnegie Mellon University is leading a multi-university team that has secured an award of up to $39.3 million from the Advanced Research Projects Agency for Health (ARPA-H) to develop a wearable monitoring system to better identify fetal distress and its cause, enabling a safer labor and delivery experience for mothers and babies. The system, called OMEGA, or Optical, Mechanical, and Electrical Global Assessment of fetal hypoxia, aims to replace 50-year old, indire...
-
Teledyne FLIR Defense Awarded $28.8 Million Contract by U.S. Customs and Border Protection for Mobile Surveillance Systems
ELKRIDGE, Md.--(BUSINESS WIRE)--Teledyne Technologies Incorporated (NYSE:TDY) announced that Teledyne FLIR Defense has won a $28.8 million contract from U.S. Customs and Border Protection (CBP), an agency of the U.S. Department of Homeland Security, to support the agency’s Enhanced Mobile Surveillance Capability–Lite (eMSC-L) program to bolster border security operations. Under the 24-month contract, Teledyne FLIR Defense will deliver an advanced version of its Lightweight Vehicle Surveillance...

-
First Trust Global Funds PLC UK Regulatory Announcement: Net Asset Value(s)
LONDON--(BUSINESS WIRE)-- Funds Date TIDM ISIN Code Shares in Issue Currency Net Asset Value NAV/per Share First Trust Indxx Innovative Transaction & Process UCITS ETF 23.06.2026 LEGR LN IE00BF5DXP42 950,002.00 USD 50,652,039.40 53.318 ...
-
First Trust Global Funds PLC UK Regulatory Announcement: Net Asset Value(s)
LONDON--(BUSINESS WIRE)-- Funds Date TIDM ISIN Code Shares in Issue Currency Net Asset Value NAV/per Share First Trust NASDAQ Clean Edge Green Energy UCITS ETF 23.06.2026 QCLN.LN IE00BDBRT036 2,325,002.00 USD 54,848,626.79 23.591 ...
-
Nebius AI Cloud 3.6 strengthens developer experience and governance for production operations
AMSTERDAM--(BUSINESS WIRE)--Nebius today unveiled Nebius AI Cloud 3.6, adding new developer experience, security and governance improvements, as well as enhanced storage capabilities for teams running AI in production on Nebius’s full-stack AI cloud platform. Version 3.6 of Nebius AI Cloud “Aether” introduces Nebius Echo, a first look at Nebius’s AI agent for controlling cloud infrastructure using natural language. Built directly into the Nebius AI Cloud web console, Echo can answer questions a...

-
Palmer Square Capital BDC Inc. Announces Second Quarter 2026 Supplemental Dividend of $0.03
MISSION WOODS, Kan.--(BUSINESS WIRE)--Palmer Square Capital BDC Inc. (NYSE: PSBD) (“Palmer Square” or the “Company”), an externally managed business development company, today announced that its Board of Directors has declared a second quarter 2026 supplemental dividend of $0.03 per share. Shareholders of record as of June 26, 2026, will receive the supplemental dividend, payable on July 13, 2026. The supplemental dividend will be paid out of the excess of the Company’s quarterly undistributed...