Newsroom
Sorted by: Latest
-
First Trust Global Funds PLC UK Regulatory Announcement: Net Asset Value(s)
LONDON--(BUSINESS WIRE)-- Funds Date TIDM ISIN Code Shares in Issue Currency Net Asset Value NAV/per Share First Trust Indxx Innovative Transaction & Process UCITS ETF 20.03.2026 LEGR LN IE00BF5DXP42 1,000,002.00 USD 46,988,377.81 46.988 ...
-
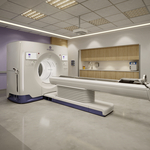
GE HealthCare’s Photonova Spectra photon-counting CT receives FDA clearance
CHICAGO--(BUSINESS WIRE)--GE HealthCare (Nasdaq: GEHC) has received 510(k) clearance from the U.S. Food and Drug Administration (FDA) for Photonova™ Spectra,i an innovative photon‑counting computed tomography (PCCT) solution powered by the company’s novel Deep Silicon detector technology and offered as a flexible platform with multiple configurations to meet diverse clinical needs. With wide coverage and the combination of ultra-high definition (UHD) spatial and spectral imaging, Photonova Spec...
-
LTM étend sa plateforme BlueVerse ™ Tech avec AppIQ, AgentIQ et FusionIQ pour accélérer l’ingénierie basée sur l’IA
MUMBAI, Inde et WARREN, New Jersey--(BUSINESS WIRE)--LTM, partenaire en créativité commerciale des plus grandes entreprises mondiales, a annoncé aujourd’hui l’extension de BlueVerseTM Tech, sa plateforme d’ingénierie basée sur l’IA, avec le lancement d’AppIQ, d’AgentIQ et de FusionIQ, trois plateformes spécialement conçues pour aider les entreprises à moderniser leurs applications, à orchestrer la livraison de logiciels axés sur l’IA et à garantir la qualité à grande échelle. Alors que le dével...

-
First Trust Global Funds PLC UK Regulatory Announcement: Net Asset Value(s)
LONDON--(BUSINESS WIRE)-- Funds Date TIDM ISIN Code Shares in Issue Currency Net Asset Value NAV/per Share First Trust NASDAQ Clean Edge Green Energy UCITS ETF 20.03.2026 QCLN.LN IE00BDBRT036 975,002.00 USD 17,129,982.88 17.569 ...
-
LTM expande a BlueVerse ™ Tech com o AppIQ, o AgentIQ e o FusionIQ para acelerar a engenharia orientada por IA
MUMBAI, Índia, e WARREN, Nova Jersey--(BUSINESS WIRE)--A LTM – parceira de criatividade empresarial das maiores empresas do mundo – anunciou hoje a expansão da BlueVerseTM Tech, sua plataforma de engenharia orientada por IA, com o lançamento do AppIQ, do AgentIQ e do FusionIQ — três plataformas desenvolvidas especificamente para ajudar as empresas a modernizar aplicativos, orquestrar a entrega de software com prioridade em IA e garantir a qualidade em escala. À medida que o desenvolvimento de s...

-
MODDEN 26 Puts Concussions Back ‘In The Game’
STATE COLLEGE, Pa.--(BUSINESS WIRE)--Nonprofit debuts free football video game mod with simulated concussion symptoms to help people recognize the dangers of playing with a concussion....

-
LTM erweitert BlueVerse ™ Tech um AppIQ, AgentIQ und FusionIQ, um KI-gestütztes Engineering voranzutreiben
MUMBAI, Indien & WARREN, New Jersey--(BUSINESS WIRE)--LTM – der Partner für Business Creativity der weltweit größten Unternehmen – gab heute die Erweiterung von BlueVerseTM Tech, seiner KI-gesteuerten Engineering-Plattform,, durch die Einführung von AppIQ, AgentIQ und FusionIQ bekannt – drei speziell entwickelte Plattformen, die Unternehmen dabei unterstützen sollen, Anwendungen zu modernisieren, eine KI-orientierte Softwarebereitstellung zu orchestrieren und Qualität in großem Maßstab zu gewäh...

-
Zero Networks Recognized as a Leader and Outperformer in the GigaOm Radar Report for Microsegmentation
ORLANDO, Fla.--(BUSINESS WIRE)--Zero Networks, the leading provider of zero trust security solutions, today announced it has been named a Leader and Outperformer in the 2026 GigaOm Radar Report for Microsegmentation, recognizing the company’s approach to identity-based microsegmentation and automated policy generation for modern hybrid environments. Zero Networks is positioned in the Innovation/Platform Play quadrant, reflecting both the platform’s capabilities and the company’s strong developm...
-
BostonGene Advances AI-Driven Disease Modeling in Oncology in Collaboration with Leading Experts in Cancer Genomics at USCAP 115th Annual Meeting
WALTHAM, Mass.--(BUSINESS WIRE)--BostonGene, developer of the leading AI foundation model for tumor and immune biology, today announced an oral presentation at the United States and Canadian Academy of Pathology (USCAP) 115th Annual Meeting. The session highlights new clinical data generated in collaboration with leading academic investigators, including Weill Cornell Medicine. The event, held from March 21-26 at the Henry B. González Convention Center in San Antonio, TX, is the world's premier...
-
LTM amplía la tecnología BlueVerse™ con AppIQ, AgentIQ y FusionIQ para acelerar la ingeniería impulsada por la IA
BOMBAY (India) y WARREN (Nueva Jersey)--(BUSINESS WIRE)--LTM, el socio en Creatividad Empresarial de las empresas más grandes del mundo, anuncia la ampliación de BlueVerseTM Tech, su plataforma de ingeniería basada en IA, con el lanzamiento de AppIQ, AgentIQ y FusionIQ: tres plataformas diseñadas específicamente para ayudar a las empresas a modernizar sus aplicaciones, coordinar la entrega de software centrada en la IA y garantizar la calidad de la ingeniería a gran escala. A medida que el desa...