Newsroom
Sorted by: Latest
-
AI構想から大規模なApplied Intelligenceへ:Sia、エージェントストアに800以上のエージェントを掲載し新たな節目
ニューヨーク--(BUSINESS WIRE)--(ビジネスワイヤ) -- 戦略、経営、およびAIを専門とする国際的なコンサルティング・グループであるシア(Sia)は、エージェント型AI分野におけるリーダーシップをさらに強めています。デジタル時代に誕生した同社は、19か国にわたる3,000人以上のコンサルタントの専門知識を活用し、組織がAI主導の変革を拡大することを支援しています。 ソリューション・インテリジェンスのスケーリング:迅速な試行から本番対応のエージェント型AI導入へ 2023年6月の生成AIプラットフォームの立ち上げおよび2025年9月の「エージェントストア」の立ち上げに続き、シアは新たなマイルストーンに到達しました。立ち上げ時には約100のエージェント、2026年初頭には400のエージェントを提供していましたが、現在では800以上のAIエージェントを提供しており、直接相談や導入に利用可能です。 シアの「エージェントストア」は、設計による学習アプローチに基づき、金融、エネルギー、公共部門、ヘルスケア、小売などの業界に加え、あらゆる企業機能において、本番運用に対応したエージ...
-
發展人工智慧雄心、大規模應用智慧:Sia Agent Store代理數量突破800大關
紐約--(BUSINESS WIRE)--(美國商業資訊)-- 專精策略、管理與人工智慧的國際諮詢顧問集團Sia不斷提升它在代理式人工智慧方面的領導地位。誕生於數位世代的該公司運用分布於19個國家的3000多位諮詢顧問的專長,協助企業擴大人工智慧驅策的轉型。 擴展解決方案智慧:從快速實驗到具備生產就緒能力的代理佈署 繼2023年6月推出生成式人工智慧平台、2025年9月推出Agent Store後,Sia再次樹立新的里程碑。該公司最初發佈時擁有約100個代理、到2026年初增加至400個,目前提供的人工智慧代理數量已突破800個,供使用者直接諮詢與佈署。 Sia Agent Store根據由設計帶動學習的理念而打造,使各類企業組織能夠快速發掘、測試並大規模佈署具備生產就緒能力的代理應用案例,對象跨金融、能源、公部門、醫療保健及零售等多個產業,並橫貫企業的所有職能。 為了加速創新週期,Sia借助其技術合作夥伴提供的高階低程式碼與無程式碼工具快速開發使用者介面。這種方法使團隊能夠迅速進行原型建置、迭代及業務採納驗證,從終端用戶和營運視角出發,找出相關性最高的代理。 Sia同時又將其代理整合...
-
从人工智能愿景到大规模应用智能:Sia达成新里程碑,其代理商店代理数量突破800个
纽约--(BUSINESS WIRE)--(美国商业资讯)-- Sia是一家专注于战略、管理和人工智能的国际咨询集团,在代理式人工智能领域持续巩固其领先地位。作为一家诞生于数字时代的咨询公司,Sia依托遍布19个国家的3,000多名顾问的专业知识,助力各类组织实现规模化人工智能驱动转型。 扩展解决方案智能:从快速实验到可投入生产的代理式部署 继2023年6月推出生成式人工智能平台以及2025年9月推出智能代理商店之后,Sia又达成了新里程碑。该平台上线时拥有约100个智能代理,2026年初增至400个,如今已提供超过800个智能代理,用户可直接进行咨询和部署。 Sia的代理商店基于“设计驱动学习”的方法构建,可帮助各类组织在金融、能源、公共部门、医疗保健和零售等行业,以及所有企业职能领域,快速发现、测试和扩展已准备就绪的代理应用场景。 为了加快创新周期,Sia利用其技术合作伙伴提供的先进低代码和无代码工具,实现用户界面的快速开发。这种方法使团队能够快速进行原型设计、迭代和验证业务应用情况,从而从终端用户和运营角度出发,确定最合适的代理。 与此同时,Sia正将其代理集成到领先的市场代理体...
-
Riassunto: Da ambizione nell'intelligenza artificiale a intelligenza applicata su larga scala: Sia raggiunge un nuovo traguardo con oltre 800 agenti nel suo Agent Store
NEW YORK--(BUSINESS WIRE)--Sia, un gruppo di consulenza internazionale specializzato in strategia, gestione e IA, continua ad ampliare la sua leadership nell'IA agentica. Nata nell'era digitale, l'azienda ora utilizza le competenze di più di 3.000 consulenti in 19 Paesi per aiutare le organizzazioni a scalare la trasformazione basata sull'IA. Intelligenza delle soluzioni scalabili: dalla sperimentazione rapida all'implementazione agentica pronta per la produzione A seguito del lancio della sua...
-
De la ambición en IA a la inteligencia aplicada a escala: Sia alcanza un nuevo hito con más de 800 agentes en su Agent Store
NUEVA YORK--(BUSINESS WIRE)--Sia, un grupo internacional de consultoría especializado en estrategia, gestión e IA, sigue ampliando su liderazgo en IA agéntica. Nacida en la era digital, la empresa aprovecha la experiencia de más de 3000 consultores en 19 países para ayudar a las organizaciones a escalar la transformación impulsada por la IA. Escalando la inteligencia de las soluciones: de la experimentación rápida a la implementación agéntica preparada para la producción Después del lanzamiento...
-
Samenvatting: Van AI-ambitie naar toegepaste intelligentie op schaal: Sia bereikt een nieuwe mijlpaal met meer dan 800 agents in de Agent Store
NEW YORK--(BUSINESS WIRE)--Sia, een internationale adviesgroep gespecialiseerd in strategie, management en AI, blijft zijn leiderschap in agentische AI uitbreiden. Het bedrijf, geboren in het digitale tijdperk, maakt gebruik van de expertise van meer dan 3.000 consultants in 19 landen om organisaties te helpen bij het opschalen van AI-gedreven transformatie. Oplossingsintelligentie opschalen: van snelle experimenten tot productieklare agentische implementatie Na de lancering van zijn generatiev...
-
A Sia alcança um novo marco com mais de 800 agentes em sua Agent Store, demonstrando ambição em IA e inteligência aplicada em escala
NOVA YORK--(BUSINESS WIRE)--A Sia, grupo internacional de consultoria especializado em estratégia, gestão e inteligência artificial (IA), continua expandindo sua liderança em IA Agentiva. Nascida na era digital, a empresa utiliza a experiência de mais de 3 mil consultores em 19 países para auxiliar as organizações a ampliarem sua transformação impulsionada pela IA. Ampliando a inteligência de soluções: da experimentação rápida à implantação de agentes prontos para produção Após o lançamento de...
-
Von KI-Ambitionen zu angewandter Intelligenz in großem Maßstab: Sia erreicht mit über 800 Agenten in seinem Agent Store einen neuen Meilenstein
NEW YORK--(BUSINESS WIRE)--Sia, eine internationale Beratungsgruppe, die sich auf Strategie, Management und KI spezialisiert hat, baut ihre Führungsposition im Bereich der agentenbasierten KI weiter aus. Das Unternehmen, das im digitalen Zeitalter gegründet wurde, nutzt das Fachwissen von mehr als 3.000 Beratern in 19 Ländern, um Unternehmen dabei zu unterstützen, ihre KI-gestützte Transformation voranzutreiben. Skalierung von Lösungsintelligenz: Vom schnellen Experimentieren bis zum produktion...
-
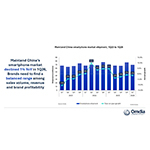
Omdia:隨著成本上揚推升裝置價格,2026 年第一季,中國大陸智慧型手機出貨量下滑 1%
倫敦--(BUSINESS WIRE)--(美國商業資訊)-- Omdia 最新研究顯示,2026 年第一季中國大陸智慧型手機市場較去年同期衰退 1%,出貨量達 6,980 萬支。2026 年第一季,零組件成本上揚(尤其是記憶體)促使主要廠商調漲產品價格,進一步延續市場下滑趨勢。華為以 1,390 萬支出貨量位居第一,拿下 20% 市占率並維持強勁動能。蘋果 (Apple) 以 1,310 萬支與 19% 市占率緊追在後,名列第二。OPPO 在整合 realme 後的首季,出貨量達 1,100 萬支,躋身前三大品牌。vivo 出貨量為 1,050 萬支名列第四,小米則以 870 萬支出貨量排名第五。 「為在記憶體價格上漲之際平衡出貨量、營收與獲利,包含小米、榮耀 (HONOR)、OPPO 與 vivo 等主要品牌,於第一季針對特定機款調漲零售價 10% 至 30%。」Omdia 首席分析師侯林( Hayden Hou) 表示:「此舉對消費者購買意願造成明顯負面影響。華為與蘋果則採取相反策略,兩者大多避免全面漲價,將成本壓力視為搶攻市占率的契機。該策略使旗下產品對消費者更具吸引力,進而締...
-
Navan Selected by Opella to Streamline Global Travel and Expense
PALO ALTO, Calif.--(BUSINESS WIRE)--Navan (NASDAQ: NAVN), the global AI-powered business travel and expense management platform, today announced it has been selected by Opella to manage its global travel and expense programme. “Navan provides our teams with an easy-to-use tool that removes the complexity from business travel and expense, improving our employee experience and giving us the real-time visibility required to effectively manage costs,” said Vincent Cotard, VP Global Head Real Estate...