

Newsroom
Sorted by: Latest
-
Smartstream’s Final ISO 20022 Paper Reveals 67% of Errors Are Due to Data Quality and Calls for a Holistic Operating Model
LONDON--(BUSINESS WIRE)--A final ISO 20022 paper reveals 67% of errors are due to data quality and calls for a holistic operating model...
-
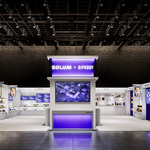
SOLUM、「リテールテック JAPAN 2026」に出展… 日本の流通市場におけるDX攻略を加速
ソウル & 東京--(BUSINESS WIRE)--(ビジネスワイヤ) -- グローバル・リテールテックのリーディングカンパニーであるSOLUM (KOSPI: 248070),(ソルエム)は、3月3日から6日まで東京ビッグサイト(Tokyo Big Sight)で開催される「リテールテック JAPAN 2026」に出展し、日本の流通市場の革新に向けた統合リテール自動化ソリューションを公開します。 日本経済新聞社(Nikkei)が主催する「リテールテック JAPAN」は、アジア最大級のリテール・デジタルトランスフォーメーション(DX)専門展示会です。毎年8万人以上のグローバル流通関係者が集結し、POS、AIデータ分析、デジタルサイネージなどの最先端技術トレンドを共有する場として知られています。 SOLUMは今回の展示で「Retail in Sync」という核心的なビジョンのもと、電子棚札(ESL)を媒介にPOS、在庫管理、モバイルアプリが有機的に連動するリアルタイムのオンライン・オフライン統合エコシステムを披露します。特に、実際の店舗環境を忠実に再現した「4大革新ゾーン(Zone)...

-
SOLUM Accelerates Japan’s Retail DX at ‘RetailTech Japan 2026’
TOKYO--(BUSINESS WIRE)--SOLUM, a retail tech leader, showcases a comprehensive suite of integrated retail automation solutions at RetailTech Japan 2026...
-
Nidec Announces the Determination of No Year-End Dividend
KYOTO, Japan--(BUSINESS WIRE)--Nidec Corporation (TOKYO: 6594; OTC US: NJDCY) (the “Company”) hereby announces that, at the meeting of the Board of Directors held on March 3, 2026, the Board resolved not to pay a dividend from surplus (year-end dividend) with a record date of March 31, 2026. We sincerely apologize for any inconvenience and concern this may cause to our shareholders, investors and other stakeholders. (1) Details of Dividend Amount Resolved Latest Dividend Forecast (Announced o...

-
Saham Group Executes a Total Return Swap on Equity to Increase Exposure to TP’s (Formerly Teleperformance) Share Capital
CASABLANCA, Morocco--(BUSINESS WIRE)--Saham Group executes a Total Return Swap on equity to increase exposure to TP’s (formerly Teleperformance) share capital...
-
Le groupe Saham met en place un instrument dérivé à rendement total afin de renforcer son exposition au capital de TP (Ex Teleperformance)
Casablanca, Maroc--(BUSINESS WIRE)--Le groupe Saham annonce qu’il a conclu en date du 2 mars 2026, auprès d’un établissement financier, un contrat financier dérivé à l’achat sur rendement total (Equity swap) portant sur un montant ne dépassant pas 355 millions d’euros et concernant les actions ordinaires de Teleperformance SE (code ISIN : FR0000051807). Le terme de ce contrat est fixé au 2 septembre 2026 ou à la date à laquelle le montant maximum est atteint, sauf conditions de marché particuli...
-
Computershare Trustees (Jersey) Limited UK Regulatory Announcement: Form 8.3
LONDON--(BUSINESS WIRE)-- FORM 8.3 PUBLIC OPENING POSITION DISCLOSURE/DEALING DISCLOSURE BY A PERSON WITH INTERESTS IN RELEVANT SECURITIES REPRESENTING 1% OR MORE Rule 8.3 of the Takeover Code (the “Code”) 1. KEY INFORMATION (a) Full name of discloser: Computershare Trustees (Jersey) Limited as trustee of the Schroders Employee Benefit Trust (b) Owner or controller of interests and short positions disclosed, if different from 1(a): The naming of nominee or vehicle companies is insufficient. Fo...
-
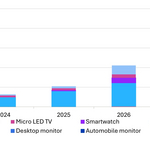
Omdia:近眼智慧手錶和公共顯示器應用推動Micro LED顯示器收入在2026年翻倍至1.05億美元
倫敦--(BUSINESS WIRE)--(美國商業資訊)-- 根據Omdia的《Micro LED顯示器市場追蹤報告》顯示,Micro LED(微發光二極體)顯示器收入預計將年增100%,從2025年的5,240萬美元增加到2026年的1.054億美元。儘管Micro LED顯示器在公共顯示器、超大尺寸電視、智慧手錶和智慧眼鏡上的應用仍然有限,但快速成熟的製造能力和新產品的普及預計將在短期內顯著推動出貨量和收入的成長。 此前,大規模商業化面臨諸多挑戰,包括光電特性不穩定、巨量轉移技術受限、背板良率低以及最關鍵的製造成本高昂。如今,由於因應這些挑戰,顯示器製造商已開始大規模生產用於Micro LED電視、公共顯示器和智慧手錶的產品。 先前傳統顯示器製造商很難涉足的LEDoS(矽基Micro LED)快速成長,尤其引人注目。LEDoS透過將寬度僅為幾奈米的Micro LED晶片電整合到半導體基板上,實現了超小型顯示器。因此,LEDoS的生產製造往往比傳統面板廠商更緊密地遵循半導體製程。 典型的LEDoS顯示器對角線尺寸為0.1至0.2英寸,解析度在4,000至6,000畫素/英寸(PPI...

-
Omdia:近眼智能手表和公共显示屏应用推动Micro LED显示器收入在2026年翻番至1.05亿美元
伦敦--(BUSINESS WIRE)--(美国商业资讯)-- 据Omdia的《Micro LED显示器市场追踪报告》显示,Micro LED(微发光二极管)显示器收入预计将同比增长100%,从2025年的5,240万美元增至2026年的1.054亿美元。尽管Micro LED显示器在公共显示屏、超大尺寸电视、智能手表和智能眼镜上的应用仍然有限,但快速成熟的制造能力和新产品的普及预计将在短期内显著推动出货量和收入的增长。 此前,大规模商业化面临诸多挑战,包括光电特性不稳定、巨量转移技术受限、背板良率低以及最为关键的制造成本高昂。如今,通过应对这些挑战,显示器制造商已开始大规模生产用于Micro LED电视、公共显示屏和智能手表的产品。 此前传统显示器制造商很难涉足的LEDoS(硅基Micro LED)快速增长,尤为引人注目。LEDoS通过将宽度仅为几纳米的Micro LED芯片电集成到半导体基板上,实现了超小型显示器。因此,LEDoS的生产制造往往比传统面板厂商更紧密地遵循半导体工艺流程。 典型的LEDoS显示器对角线尺寸为0.1至0.2英寸,分辨率在4,000至6,000像素/英寸(...
-
TotalEnergies SE UK Regulatory Announcement: Electricity: TotalEnergies Partners with AllianzGI to Develop 800 MW of Battery Storage Projects in Germany
PARIS--(BUSINESS WIRE)-- Regulatory News: As part of its growth in electricity in Germany, TotalEnergies (Paris:TTE) (LSE:TTE) (NYSE:TTE) has signed an agreement with Allianz Global Investors (AllianzGI) for the sale of a 50% stake in a portfolio of 11 battery storage projects with a total capacity of 789 MW – 1628 MWh. With this agreement, the partners will deliver an investment of €500 million in critical energy infrastructure for Germany, of which 70% will be financed by the debt. Nearly 80...