Newsroom
Sorted by: Latest
-
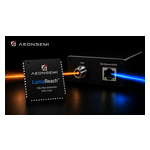
Aeonsem 發布 LumaReach™
加利福尼亞州聖克拉拉--(BUSINESS WIRE)--(美國商業資訊)-- Aeonsemi ( www.aeonsemi.com ),一家混合訊號與 DSP 連線 IC 領域的領導廠商,今日宣布推出 LumaReach™,業界首款商用 10 Gbps 同軸乙太網路控制器 IC。作為一項新型光纖延伸技術所開發的 LumaReach™,可透過北美及歐洲約 1.5 億戶家庭中已安裝的現有 RG6 與 RG59 同軸纜線,提供光纖級延遲與頻寬,使服務供應商得以加速部署多千兆位元服務,同時避免耗資龐大的最後一哩光纖佈建工程。 AS27010 是一款點對點、全雙工「同軸乙太網路」網路控制器積體電路,可透過配備標準 F 型連接器的 75 歐姆 RG6 與 RG59 纜線運作,並利用過去用於有線電視及「同軸多媒體聯盟」的現有牆內同軸纜線。LumaReach™網路控制器可透過單一同軸纜線提供對稱的 10 Gbps 傳輸速率,並提供高達 20 Gbps 的總雙向吞吐量。LumaReach™支援同軸供電(PoC)部署,無需在基座、界接點或遠端終端設備處另外配置交流電源。 「AI 正在重塑所有為其提供資...
-
Mitsubishi Electric and Sony Semiconductor Solutions Agree to Establish a Joint Venture to Build AI Vision Sensor Solutions for Manufacturing Applications
TOKYO--(BUSINESS WIRE)--Mitsubishi Electric Corporation (“Mitsubishi Electric”) and Sony Semiconductor Solutions Corporation (“Sony”) have entered into a definitive agreement on a strategic partnership aimed at accelerating the automation and advancement of manufacturing equipment and manual operations in the manufacturing industry. Under the partnership, the two companies will establish a newly formed joint venture (“JV”), Advanced Vision Solutions Co., Ltd., which is scheduled to begin operat...
-
FPT Partners with Nuummite and e-CENS to Explore Strategic Technology Collaboration Across the Middle East and Africa
HANOI, Vietnam--(BUSINESS WIRE)--Global technology corporation FPT and Nuummite, a MEA-based digital transformation and intelligent automation firm, have signed a Strategic Cooperation Agreement to advance collaboration across the Middle East and Africa, creating a stronger platform for enterprise transformation through customer experience, data, AI, and cloud solutions. As part of the broader collaboration, e-CENS will contribute its regional data and analytics expertise alongside Nuummite’s d...
-
TryfactaEDU Global Foundation to Lead UNESCO MOST BRIDGES Coalition's South Asia Effort
AHMEDABAD, India--(BUSINESS WIRE)--In a significant step towards strengthening sustainability research and international collaboration in South Asia, TryfactaEDU Global Foundation has been selected to host the South Asia Regional Programme Office of the BRIDGES Coalition at Gujarat International Finance Tec City (GIFT City), Gujarat. The BRIDGES Directorate and the International Programme Office at the University of Wales Trinity Saint David will work closely with the Foundation to establish th...
-
CI Financial Holdings Ltd. Prices Private Offering of U.S. Dollar Junior Subordinated Notes
LONDON--(BUSINESS WIRE)--CI Financial Holdings Ltd. has priced its private offering of US$500 million principal amount of fixed-rate resettable junior subordinated notes....
-
WasabiとMegaportが提携、次世代のAIおよびクラウドインフラを推進
東京--(BUSINESS WIRE)--(ビジネスワイヤ) -- Wasabi Hot Cloud Storageを提供するWasabi Technologies(本社:米国マサチューセッツ州ボストン、日本法人:Wasabi Technologies Japan合同会社、東京都千代田区、以下 Wasabi)は本日、世界をリードする自動化インフラプラットフォーム企業であるMegaport Limited(ASX:MP1、以下 Megaport)と次世代のネオクラウドインフラの提供に向けた協業を目的とする戦略的パートナーシップを締結したことを発表しました。本提携により、WasabiはMegaport Storageのクラウド オブジェクト ストレージ レイヤーを支える基盤技術を提供します。 AIの普及に伴い新たなユースケースや関連技術が生まれた結果、AIツールの開発・展開に必要な高度な演算処理、ネットワーク、ストレージを支える専門のインフラストラクチャに対する需要が高まっています。「ネオクラウド(Neocloud)」は、高性能な演算処理や安全なデータストレージなど、AIに特化して構築さ...

-
ExaGrid تعلن عن تسجيل أفضل النتائج الربع سنوية في تاريخها من حيث قيمة الحجوزات والإيرادات
مارلبورو، ماساتشوستس--(BUSINESS WIRE)--أعلنت ExaGrid®، أكبر مورّد مستقل في العالم لحلول تخزين النسخ الاحتياطي، والتي تقدِّم نظام التخزين المتعدد الطبقات للنسخ الاحتياطي مع أعلى مستويات الأمان وتقنية قفل مدة الاحتفاظ المدعومة بالذكاء الاصطناعي لاستعادة البيانات من برامج الفدية، اليوم عن أنها حققت أفضل أداء ربعي في تاريخها من حيث الحجوزات والإيرادات خلال الربع الثاني المنتهي في 30 يونيو 2026، مسجلةً نموًا في الإيرادات بنسبة مزدوجة الرقم مقارنةً بالربع الثاني من عام 2025، إلى جانب تحقيق نمو في الإي...
-
PNR Investors Have Opportunity to Join Pentair plc Fraud Investigation with the Schall Law Firm
LOS ANGELES--(BUSINESS WIRE)--PNR Investors Have Opportunity to Join Pentair plc Fraud Investigation with the Schall Law Firm...
-
UTZ Investors Have the Opportunity to Join Investigation of Utz Brands, Inc. with the Schall Law Firm
LOS ANGELES--(BUSINESS WIRE)--UTZ Investors Have the Opportunity to Join Investigation of Utz Brands, Inc. with the Schall Law Firm...
-
越境ECサイト「WAFUU.COM」、公式キャラクター“Mochi”を発表
東京--(BUSINESS WIRE)--(ビジネスワイヤ) -- 日本の商品を世界へ届ける越境ECサイト「WAFUU.COM」は、本日、公式キャラクター「Mochi(モチ)」を発表しました。Mochiは、WAFUU.COMを通じて日本の魅力的な商品と出会う楽しさを、やさしく、親しみやすく伝えていく存在です。今後はWAFUU.COMのサイト、SNS、キャンペーン、同梱物、各種クリエイティブを通じて、世界中のファンとのコミュニケーションを担います。 デビュームービーは公式サイトで公開中です。 ▶ Mochi公式サイト:https://mochi.wafuu.com/ 1. Mochiについて Mochiは、“日本の商品を選ぶ楽しさ”そのものを象徴するキャラクターとして誕生しました。やわらかく丸みのあるシルエット、やさしい表情、印象に残るチャームポイントを持ち、初めてWAFUU.COMを訪れる方にも、すでに日本のカルチャーを愛する方にも自然に寄り添うデザインを目指しています。ブランドの世界観を視覚的に伝えるだけでなく、「また会いたい」「保存したい」「シェアしたい」と感じてもらえる存在にな...