

Newsroom
Sorted by: Latest
-
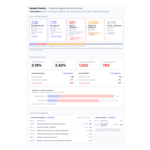
BrainCheck® Launches Population Analytics to Scale Proactive Cognitive Care
AUSTIN, Texas--(BUSINESS WIRE)--Blood-based biomarkers and disease-modifying therapies are rapidly changing Alzheimer's disease care, but one challenge remains largely unsolved: how do health systems identify which patients should be evaluated first? Today, most patients are identified only during an Annual Wellness Visit (AWV), where cognitive screening competes with dozens of other preventive care requirements. As a result, many patients who may benefit from further evaluation are never ident...
-
Qube Research & Technologies LTD UK Regulatory Announcement: Form 8.3
LONDON--(BUSINESS WIRE)-- FORM 8.3 PUBLIC OPENING POSITION DISCLOSURE/DEALING DISCLOSURE BY A PERSON WITH INTERESTS IN RELEVANT SECURITIES REPRESENTING 1% OR MORE Rule 8.3 of the Takeover Code (the “Code”) 1. KEY INFORMATION (a) Full name of discloser: Qube Research & Technologies Limited (b) Owner or controller of interests and short positions disclosed, if different from 1(a): The naming of nominee or vehicle companies is insufficient. For a trust, the trustee(s), settlor and beneficiari...
-
First Trust Global Funds PLC UK Regulatory Announcement: Net Asset Value(s)
LONDON--(BUSINESS WIRE)-- Funds Date TIDM ISIN Code Shares in Issue Currency Net Asset Value NAV/per Share First Trust Indxx NextG UCITS ETF 29.07.2026 NXTG.LN IE00BWTNM743 170,002.00 USD 8,814,944.10 51.852 ...
-
Accurate Group Expands Direct Title Capabilities Across California and Nevada
CLEVELAND--(BUSINESS WIRE)--Accurate Group, a leading provider of technology-enabled real estate solutions, today announced the continued expansion of its direct title and escrow capabilities with the issuance of an underwritten title company license covering all of California and a title agency license for Nevada. While Accurate Group has long supported clients nationwide through its extensive title network, direct licensing in California and Nevada licensing represents a significant step in e...
-
Hyperfine Announces the Release of Multiple Peer-Reviewed Publications, Expanding Clinical Evidence for the Swoop® System Across a Growing Number of Sites of Care
GUILFORD, Conn.--(BUSINESS WIRE)--Multiple peer-reviewed publications in Journal of Neurosurgery and Stroke strengthen evidence for portable MRI in stroke and neurosurgical settings....

-
MooreWays To Mind Health Welcomes Two Senior Clinicians, Expanding Psychiatric and Neuropsychological Care
EXTON, Pa.--(BUSINESS WIRE)--MooreWays To Mind Health™, a leading integrative mental health practice serving Chester and Delaware Counties, has added two senior clinicians to its team: Dr. Blaine Cloud, a nationally recognized clinical neuropsychologist, and Jacqueline Churchman, MSN, PMHNP-BC, AGPCNP-C, a double board-certified psychiatric nurse practitioner. Their arrival expands the practice's integrated model of care, bringing psychotherapy, psychiatric services, neuropsychological testing,...
-
First Trust Global Funds PLC UK Regulatory Announcement: Net Asset Value(s)
LONDON--(BUSINESS WIRE)-- Funds Date TIDM ISIN Code Shares in Issue Currency Net Asset Value NAV/per Share First Trust Dow Jones International Internet UCITS ETF 29.07.2026 FDNI.LN IE00BT9PVG14 425,002.00 USD 7,785,210.08 18.318 ...
-
First Trust Global Funds PLC UK Regulatory Announcement: Net Asset Value(s)
LONDON--(BUSINESS WIRE)-- Funds Date TIDM ISIN Code Shares in Issue Currency Net Asset Value NAV/per Share First Trust US Equity Income UCITS ETF 29.07.2026 UIGB IE00079WNSI6 2,591.00 GBP 74,519.30 28.761 ...
-
First Trust Global Funds PLC UK Regulatory Announcement: Net Asset Value(s)
LONDON--(BUSINESS WIRE)-- Funds Date TIDM ISIN Code Shares in Issue Currency Net Asset Value NAV/per Share First Trust US Equity Income UCITS ETF 29.07.2026 UNCU.LN IE00BD6GCF16 869,652.00 USD 44,188,484.29 50.812 ...