Newsroom
Sorted by: Latest
-
First Trust Global Funds PLC UK Regulatory Announcement: Net Asset Value(s)
LONDON--(BUSINESS WIRE)-- Funds Date TIDM ISIN Code Shares in Issue Currency Net Asset Value NAV/per Share First Trust Global Capital Strength ESG Leaders UCITS ETF 04.06.2026 FCSG IE00BKPSPT20 800,002.00 USD 34,328,520.62 42.911 ...
-
First Trust Global Funds PLC UK Regulatory Announcement: Net Asset Value(s)
LONDON--(BUSINESS WIRE)-- Funds Date TIDM ISIN Code Shares in Issue Currency Net Asset Value NAV/per Share First Trust FactorFX UCITS ETF 04.06.2026 FXGB LN IE00BD5HBR05 47,692.00 GBP 960,709.81 27.081 ...
-
First Trust Global Funds PLC UK Regulatory Announcement: Net Asset Value(s)
LONDON--(BUSINESS WIRE)-- Funds Date TIDM ISIN Code Shares in Issue Currency Net Asset Value NAV/per Share First Trust FactorFX UCITS ETF 04.06.2026 FTFX IE00BD5HBQ97 63,402.00 USD 1,690,852.57 26.669 ...
-
UMC Reports Sales for May 2026
TAIPEI, Taiwan--(BUSINESS WIRE)--United Microelectronics Corporation (NYSE: UMC; TWSE: 2303) (“UMC”), today reported unaudited net sales for the month of May 2026. Revenues for May 2026 Period 2026 2025 Y/Y Change Y/Y (%) May 22,943,755 19,480,057 3,463,698 17.78% Jan.-May 106,645,602 97,793,544 8,852,058 9.05% (*) All figures in thousands of New Taiwan Dollars (NT$), except for percentages (**) All figures are consolidated Additional information about UMC is available on the web at https://www...
-
Gilead Applauds Collaborative Efforts to Launch Lenacapavir for HIV Prevention in South Africa
FOSTER CITY, Calif.--(BUSINESS WIRE)--Gilead applauds the leadership of the Government of South Africa and the Global Fund for accelerating access to lenacapavir, a long-acting HIV prevention medication. This marks an important step toward expanding access to lenacapavir for communities most affected by HIV. “South Africa is at the heart of global efforts to end HIV. With the country’s launch of lenacapavir, there is now an opportunity to rapidly accelerate progress,” said Daniel O’Day, Chairma...
-
L’Assemblée des Parties Prenantes de Veolia appelle à accélérer sur la réutilisation des eaux usées traitées pour renforcer la sécurité hydrique
PARIS--(BUSINESS WIRE)--Alors que l’ONU qualifie la situation actuelle de « faillite hydrique »1, Veolia lance, à travers le travail de son Assemblée des Parties Prenantes, nouvellement créée, un appel à l’action pour accélérer le déploiement de solutions technologiques éprouvées, à l’instar de la réutilisation des eaux usées traitées. Avec seulement 8%2 de l’eau actuellement recyclée à l’échelle mondiale, le déploiement de la réutilisation des eaux usées traitées se heurte à des obstacles psyc...

-
Veolia’s Stakeholders Assembly Calls for Accelerated Uptake of Water Reuse to Strengthen Water Security
PARIS--(BUSINESS WIRE)--Veolia’s Stakeholders Assembly calls for accelerated uptake of water reuse to strengthen water security...

-
JCÖNTENTS:「即使語言不通,也能輕鬆到達目的地」
日本京都--(BUSINESS WIRE)--(美國商業資訊)-- JCÖNTENTS於6月1日發布免費GOPin智慧型手機應用程式! JCÖNTENTS Co., Ltd.(京都府;代表:Takamasa Yoshimitsu)於6月1日發布免費GOPin智慧型手機應用程式! GOPin是一款全新的多語言導航應用,透過二維碼為赴日遊客提供當地計程車服務。使用者只需在地圖上選擇目的地並出示二維碼,計程車司機掃描後即可在Google地圖上立即顯示精準路線。 從此告別輸入地址和語言不通的煩惱。 GOPin無需註冊,完全免費使用。 致赴日遊客 告別語言障礙,只需向計程車司機出示您的智慧型手機! 多語言地圖功能:*可顯示英文、日文、中文(正體、簡體)和韓文。 用您最熟悉的語言輕鬆找到目的地。 一鍵產生二維碼:只需在目的地放置圖釘,即可立即產生專屬二維碼。 離線也能輕鬆出行:只需在螢幕上顯示產生的二維碼,無需任何語言交流。 GOPin官方網站:https://www.gopin.jp/ 免責聲明:本公告之原文版本乃官方授權版本。譯文僅供方便瞭解之用,煩請參照原文,原文版本乃唯一具法律效力之版本。...

-
JCÖNTENTS“即使存在语言障碍,也能轻松抵达目的地。”
日本京都--(BUSINESS WIRE)--(美国商业资讯)-- JCÖNTENTS于6月1日推出免费GOPin智能手机应用程序! JCÖNTENTS Co., Ltd.(京都府;代表:Takamasa Yoshimitsu)于6月1日发布了面向智能手机的免费应用程序GOPin! GOPin是一款全新的多语言导航应用,通过二维码将到访日本的游客与当地出租车司机连接起来。用户只需在地图上选择目的地并出示二维码,出租车司机扫描后,Google地图便会立即显示精确的路线。 再也不用担心输入地址或发音问题。 GOPin无需用户注册,且可免费使用。 适用于访日游客 告别语言障碍——只需把智能手机给出租车司机看一下! 多语言地图功能:*支持英语、日语、中文(繁体、简体)和韩语。 轻松用您最熟悉的语言找到目的地。 一键生成二维码:只需在目的地标记一个位置,即可立即生成唯一的二维码。 即使离线也能轻松应对:只需在屏幕上显示生成的二维码,无需任何沟通。 GOPin官方网站: https://www.gopin.jp/ 免责声明:本公告之原文版本乃官方授权版本。译文仅供方便了解之用,烦请参照原文,原文版...

-
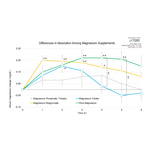
Riassunto: Tsuno Rice Fine Chemicals: studio comparativo sull'assorbimento del "Rice Magnesium" derivato dalla crusca di riso fornisce nuove indicazioni sul suo profilo di assorbimento graduale e prolungato
WAKAYAMA, Giappone--(BUSINESS WIRE)--Tsuno Rice Fine Chemicals Co., Ltd. ha annunciato i risultati di uno studio interno sugli esseri umani che ha dimostrato come il suo ingrediente proprietario derivato dalla crusca di riso, "Rice Magnesium" sia in grado di garantire un assorbimento graduale e continuo di magnesio rispetto al altre fonti di magnesio. I risultati suggeriscono benefici potenziali per un migliore riposo, la gestione dell'affaticamento muscolare durante l'esercizio fisico prolunga...