Newsroom
Sorted by: Latest
-
ONON Investors Have Opportunity to Join On Holding AG Fraud Investigation with the Schall Law Firm
LOS ANGELES--(BUSINESS WIRE)--ONON Investors Have Opportunity to Join On Holding AG Fraud Investigation with the Schall Law Firm...
-
エンジェルアライン・テクノロジー(6699.HK) 、2025年度決算を発表:臨床の卓越性への情熱が世界的な成長を牽引
カリフォルニア州サン・クレメンテ--(BUSINESS WIRE)--(ビジネスワイヤ) -- エンジェルアライン・テクノロジー(6699.HK)(以下「エンジェル」または「当社」)は、2025年度決算を発表しました。当期において、当社はグローバル市場および中国市場で引き続き好調な業績を維持しました。総症例数は53万2,400件(前年比48.1%増)、売上高は3億7,030万米ドル(同37.8%増)、調整後純利益は4,380万米ドル(同63.0%増)となりました。こうした業績は、臨床の卓越性に対するエンジェルの情熱と、優秀な人材が協力して顧客のニーズに応えられるよう後押しする、オープンかつ包摂的な企業文化によって牽引されたものであると当社は述べています。 エンジェルの最高経営責任者(CEO)であるフォックス・フーは次のように述べています。「クリア・アライナー業界は複雑で、多分野にわたる専門性が求められます。この業界では、最高水準の技術力と運営能力に加え、世界各地のプロフェッショナルによるシームレスな連携が不可欠となります。エンジェルのオープンかつ包摂的な企業文化は、臨床の卓越性を追求...
-
A Angelalign Technology (6699.HK) divulga resultados de 2025: Paixão pela excelência clínica impulsiona o crescimento global
SAN CLEMENTE, Califórnia--(BUSINESS WIRE)--A Angelalign Technology Inc. (6699.HK) (“Angel” ou a “Empresa”) divulgou seus resultados financeiros para o ano fiscal de 2025. Durante o período analisado, a Empresa continuou apresentando bom desempenho tanto no mercado global quanto no mercado chinês. O volume total de casos foi de 532.400, um aumento de 48,1%, a receita foi de US$ 370,3 milhões, um aumento de 37,8%, e o lucro líquido ajustado foi de US$ 43,8 milhões, um aumento de 63,0%. Os resulta...
-
Angelalign Technology (6699.HK) publie ses résultats pour 2025 : la passion pour l'excellence clinique stimule la croissance mondiale
SAN CLEMENTE, Californie--(BUSINESS WIRE)--Angelalign Technology Inc. (6699.HK) (« Angel » ou la « société ») vient de publier ses résultats financiers pour l’exercice 2025. Au cours de la période de référence, la société a continué d'afficher de bons résultats tant sur le marché mondial que sur le marché chinois. Le volume total de dossiers a été de 532 400, en hausse de 48,1 %, le chiffre d'affaires de 370,3 millions USD, en hausse 37,8 %, et le bénéfice net ajusté de 43,8 millions USD, en ha...
-
Angelalign Technology (6699.HK) veröffentlicht Ergebnisse für 2025: Das Streben nach klinischer Exzellenz treibt das weltweite Wachstum voran
SAN CLEMENTE, Kalifornien--(BUSINESS WIRE)--Angelalign Technology Inc. (6699.HK) („Angel“ oder das „Unternehmen“) hat seine Finanzergebnisse für das Geschäftsjahr 2025 veröffentlicht. Im Berichtszeitraum verzeichnete das Unternehmen sowohl auf dem globalen Markt als auch auf dem chinesischen Markt weiterhin eine positive Entwicklung. Das Gesamtvolumen der Fälle betrug 532.400, was einem Anstieg von 48,1 % entspricht; der Umsatz belief sich auf 370,3 Millionen US-Dollar, was einem Anstieg von 37...
-
SBC Medical gibt Finanzergebnisse des vierten Quartals und des Gesamtjahres 2025 bekannt
IRVINE, Kalif.--(BUSINESS WIRE)--SBC Medical Group Holdings Incorporated (Nasdaq: SBC) („SBC Medical” oder das Unternehmen”) ist eine Management Services Organisation, die zahlreiche Franchise-Unternehmen in unterschiedlichen medizinischen Bereichen betreibt. Heute hat die Gesellschaft ihre Finanzergebnisse für das vierte Quartal 2025 (drei Monate, endend am 31. Dezember 2025) und das Gesamtgeschäftsjahr 2025 (zwölf Monate, endend am 31. Dezember 2025) bekannt gegeben. Highlights des vierten Qu...
-
SBC Medical annonce ses résultats financiers pour le quatrième trimestre et l’exercice 2025
IRVINE, Californie--(BUSINESS WIRE)--SBC Medical Group Holdings Incorporated (Nasdaq : SBC) (« SBC Medical » ou la « société »), une organisation de services de gestion exploitant un large éventail d’activités en franchise dans divers domaines médicaux, a annoncé aujourd’hui ses résultats financiers pour le quatrième trimestre de l’exercice 2025 (trimestre clos le 31 décembre 2025) et pour l’ensemble de l’exercice 2025 (exercice clos le 31 décembre 2025). Chiffres du quatrième trimestre 2025 Le...
-
Super Micro Computer, Inc. Sued for Securities Law Violations - Contact the DJS Law Group to Discuss Your Rights – SMCI
LOS ANGELES--(BUSINESS WIRE)--Super Micro Computer, Inc. Sued for Securities Law Violations - Contact the DJS Law Group to Discuss Your Rights – SMCI...
-
ImmunityBio, Inc. Sued for Securities Law Violations - Contact the DJS Law Group to Discuss Your Rights – IBRX
LOS ANGELES--(BUSINESS WIRE)--ImmunityBio, Inc. Sued for Securities Law Violations - Contact the DJS Law Group to Discuss Your Rights – IBRX...
-
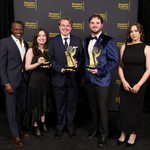
45th College Television Awards Winners Announced by Television Academy Foundation
LOS ANGELES--(BUSINESS WIRE)--The Television Academy Foundation announced the winners of the 45th College Television Awards, which recognize and reward excellence in student-produced programs from colleges nationwide, tonight at a star-studded awards presentation at the Saban Media Center in North Hollywood, California. The 2026 winners were presented awards by top television stars including Samuel Arnold (Emily in Paris), Rhenzy Feliz (The Penguin), Ashby Florence (TikTok influencer), Ezra Fre...