

Newsroom
Sorted by: Latest
-
REGN Investors Have Opportunity to Lead Regeneron Pharmaceuticals, Inc. Securities Fraud Lawsuit with the Schall Law Firm
LOS ANGELES--(BUSINESS WIRE)--REGN Investors Have Opportunity to Lead Regeneron Pharmaceuticals, Inc. Securities Fraud Lawsuit with the Schall Law Firm...
-
Samenvatting: Yoshihiro Shimamura voegt zich bij de “Investors Circle 2026” van Marché du Film als uitgenodigde investeerder ter ondersteuning van een nieuwe speelfilm
OSAKA, Japan--(BUSINESS WIRE)--Shimamura Yoshihiro Film Production Co., Ltd. (Hoofdkantoor: Osaka, Japan; gevolmachtigd bestuurder: Yoshihiro Shimamura), een bedrijf actief in filmproductie en investeringen, maakte vandaag bekend dat gevolmachtigd bestuurder Yoshihiro Shimamura heeft beslist om in een internationale speelfilm te investeren nadat het bedrijf werd uitgenodigd bij de “Investors Circle 2026” — een onderscheiding die zijn standing weerspiegelt als een van de hoogst aangeschreven fil...

-
Riassunto: Yoshihiro Shimamura entra a far parte dell’“Investors Circle 2026” del Marché du Film come investitore invitato, sostenendo un nuovo lungometraggio
OSAKA, Giappone--(BUSINESS WIRE)--Shimamura Yoshihiro Film Production Co., Ltd. (sede centrale: Osaka, Giappone; direttore rappresentativo: Yoshihiro Shimamura), società attiva nella produzione e negli investimenti cinematografici, oggi ha annunciato che il Direttore rappresentativo Yoshihiro Shimamura ha deciso di investire in un lungometraggio internazionale dopo essere stato invitato all’“Investors Circle 2026” – un riconoscimento che ne rispecchia la reputazione di uno dei produttori e inve...

-
Yoshihiro Shimamura intègre l'« Investors Circle 2026 » du Marché du Film en tant qu'investisseur invité et apporte son soutien à un nouveau long métrage
OSAKA, Japon--(BUSINESS WIRE)--Shimamura Yoshihiro Film Production Co., Ltd. (Siège social : Osaka, Japon ; administrateur délégué : Yoshihiro Shimamura), société active dans la production et l'investissement cinématographiques, a annoncé aujourd'hui que son administrateur délégué, Yoshihiro Shimamura, a décidé d'investir dans un long métrage international après avoir été invité à intégrer l'« Investors Circle 2026 ». Cette distinction témoigne de son statut de producteur et d'investisseur parm...

-
Resumen: Yoshihiro Shimamura se une al «Investors Circle 2026» del Marché du Film como inversor invitado y apuesta por un nuevo largometraje
OSAKA, Japón--(BUSINESS WIRE)--Shimamura Yoshihiro Film Production Co., Ltd. (Sede central: Osaka, Japón; director representante: Yoshihiro Shimamura), una empresa dedicada a la producción e inversión cinematográfica, ha anunciado hoy que su director representante, Yoshihiro Shimamura, ha decidido invertir en un largometraje internacional tras recibir una invitación para formar parte del «Investors Circle 2026», un reconocimiento que refleja su prestigio como uno de los productores e inversores...

-
PLNT Investors Have Opportunity to Lead Planet Fitness, Inc. Securities Fraud Lawsuit with the Schall Law Firm
LOS ANGELES--(BUSINESS WIRE)--PLNT Investors Have Opportunity to Lead Planet Fitness, Inc. Securities Fraud Lawsuit with the Schall Law Firm...
-
GPGI Investors Have Opportunity to Lead GPGI, Inc. Securities Fraud Lawsuit with the Schall Law Firm
LOS ANGELES--(BUSINESS WIRE)--GPGI Investors Have Opportunity to Lead GPGI, Inc. Securities Fraud Lawsuit with the Schall Law Firm...
-
NUBURU Announces Closing of $38.0 Million Public Offering
DENVER--(BUSINESS WIRE)--NUBURU, Inc. (NYSE American: BURU), a next-generation dual-use Defense & Security integrated platform company, today announced the closing of its previously announced best-efforts public offering, generating gross proceeds of approximately $38.0 million, before deducting placement agent fees and other offering expenses. The offering consisted of an aggregate of 244,372,984 shares of common stock and/or pre-funded warrants to purchase shares of common stock, together...
-
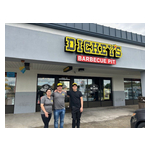
Husband-and-Wife Team Open Camp Hill Dickey's, Plan Upgrades and Community Celebration
HARRISBURG, Pa.--(BUSINESS WIRE)--A new husband-and-wife ownership team has stepped behind the smoker at Dickey's Barbecue Pit in Camp Hill and is already planning investments designed to enhance the guest experience while continuing the restaurant's tradition of serving authentic, slow-smoked Texas barbecue.Marten and Nermin Abdou officially started their franchise journey with the Dickey's Barbecue Pit located in Camp Hill on June 22 and are excited to serve the community they have called home...
-
Les données d'Incyte seront présentées durant quatre présentations orales rapides au Congrès 2026 de la Société européenne d'oncologie médicale (ESMO) pour soutenir les efforts visant à améliorer les résultats dans les cancers difficiles à traiter
WILMINGTON, Delaware--(BUSINESS WIRE)--Incyte (Nasdaq : INCY) annonce aujourd'hui la présentation de données de plusieurs programmes de son portefeuille d'oncologie lors de six présentations au Congrès 2026 de la Société européenne d'oncologie médicale (ESMO), qui se tiendra du 23 au 27 octobre 2026 à Madrid. « Les données présentées à l’ESMO illustreront l’engagement d’Incyte à faire progresser l’innovation pour les patients atteints de cancer », déclare Pablo J. Cagnoni, M.D., président d’Inc...