

Newsroom
Sorted by: Latest
-
Life Science Cares Boston Raises Over $1 Million at Record-Breaking Impact Breakfast, Rallying Industry to “Go Deeper” in Fight Against Poverty
BOSTON--(BUSINESS WIRE)--Life Science Cares Boston raised over $1M at its annual Impact Breakfast, convening 550+ industry leaders and launching its 10-year anniversary....

-
Mirion Announces Earnings Release and Conference Call Date for First Quarter 2026
ATLANTA--(BUSINESS WIRE)--Mirion (NYSE: MIR) announced today that it will release financial results for first quarter 2026 after market close on Tuesday, April 28, 2026. Following the news release, the company will host a conference call the next day, Wednesday, April 29, 2026, at 10:00 am ET to discuss the results. Participants may access the call by dialing 1-877-407-9208 or 1-201-493-6784, and requesting to join the Mirion Technologies, Inc. earnings call. A live webcast will also be availab...
-
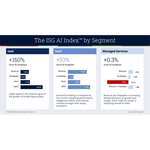
ISG Launches First-of-its-Kind Index to Measure AI’s Impact on Technology Services Sector
STAMFORD, Conn.--(BUSINESS WIRE)--ISG today launched the ISG AI Index™, a first-of-its-kind benchmark measuring how AI is impacting the global technology and business services sector....
-
CACI Continues to Deliver Accurate, Mission-Ready Tactical Satellite Communications to Special Operations Forces
RESTON, Va.--(BUSINESS WIRE)--CACI International Inc (NYSE: CACI) announced today that it has been awarded a base year technology task order with four option years valued at up to $231 million continuing nearly two decades of service to the U.S. Special Operations Command. CACI will deliver accurate, near-real-time satellite communications support providing program visibility to the Naval Information Warfare Center (NIWC) Atlantic. “CACI’s long-standing relationship with NIWC Atlantic and our c...
-
Inventia Life Science Launches RASTRUM Validated Solutions to Accelerate Decision-Grade Data
SYDNEY--(BUSINESS WIRE)--Inventia Life Science today announced the launch of RASTRUM™ Validated Solutions, a new product offering designed to help drug discovery teams generate decision-grade data from human-relevant 3D cell models with greater speed, confidence, and reproducibility. Powered by the RASTRUM platform, Validated Solutions provide predefined model blueprints for reproducible, biologically relevant 3D data in a defined context of use. Validated Solutions are part of Inventia Life Sc...
-
Samson Rock Capital LLP UK Regulatory Announcement: Form 8.3
LONDON--(BUSINESS WIRE)-- Ap27 FORM 8.3 IRISH TAKEOVER PANEL OPENING POSITION DISCLOSURE/DEALING DISCLOSURE UNDER RULE 8.3 OF THE IRISH TAKEOVER PANEL ACT, 1997, TAKEOVER RULES, 2022 BY PERSONS WITH INTERESTS IN RELEVANT SECURITIES REPRESENTING 1% OR MORE 1. KEY INFORMATION (a) Full name of discloser SAMSON ROCK CAPITAL LLP (b) Owner or controller of interests and short positions disclosed, if different from 1(a) The naming of nominee or vehicle companies is insufficient. For a trust, the trus...
-
Imagine Learning Introduces Enhancements Across Curriculum, Assessment, and Services for Back to School 2026
TEMPE, Ariz.--(BUSINESS WIRE)--Imagine Learning today announced updates across its curriculum, courseware, assessment, and services portfolio. The enhancements help educators work more efficiently, better understand student learning, and extend support where it’s needed most — bringing curriculum, insight, and support closer to the daily work of teaching. Across the portfolio, these updates are built for the moment of instruction, making student learning more visible and helping schools drive s...
-
First Trust Global Funds PLC UK Regulatory Announcement: Net Asset Value(s)
LONDON--(BUSINESS WIRE)-- Funds Date TIDM ISIN Code Shares in Issue Currency Net Asset Value NAV/per Share First Trust Nasdaq Clean Edge Smart Grid Infrastructure UCITS ETF 15.04.2026 GRDU.LN IE000J80JTL1 29,950,002.00 USD 1,855,419,221.40 61.951 ...
-
First Trust Global Funds PLC UK Regulatory Announcement: Net Asset Value(s)
LONDON--(BUSINESS WIRE)-- Funds Date TIDM ISIN Code Shares in Issue Currency Net Asset Value NAV/per Share First Trust Vest U.S. Equity Moderate Buffer UCITS ETF - November 15.04.2026 GNOV LN IE000OJ31JQ4 1,050,002.00 USD 37,502,403.82 35.717 ...
-
Vir Biotechnology Announces Closing of Global Strategic Collaboration with Astellas for the Treatment of Prostate Cancer
SAN FRANCISCO--(BUSINESS WIRE)--Vir Biotechnology, Inc. (Nasdaq: VIR) today announced that its global collaboration and licensing agreement with Astellas announced on February 23, 2026 has closed following expiration of the waiting period under the Hart-Scott-Rodino Antitrust Improvements Act of 1976. The collaboration aims to accelerate the development of VIR-5500, a prostate-specific membrane antigen (PSMA)-targeted, PRO-XTEN® dual-masked T-cell engager (TCE) for metastatic prostate cancer. S...