

Newsroom
Sorted by: Latest
-
Samson Rock Capital LLP UK Regulatory Announcement: Form 8.3
LONDON--(BUSINESS WIRE)-- FORM 8.3 PUBLIC OPENING POSITION DISCLOSURE/DEALING DISCLOSURE BY A PERSON WITH INTERESTS IN RELEVANT SECURITIES REPRESENTING 1% OR MORE Rule 8.3 of the Takeover Code (the “Code”) 1. KEY INFORMATION (a) Full name of discloser: SAMSON ROCK CAPITAL LLP (b) Owner or controller of interests and short positions disclosed, if different from 1(a): The naming of nominee or vehicle companies is insufficient. For a trust, the trustee(s), settlor and beneficiaries must be named....
-
NATIXIS UK Regulatory Announcement: Form 8.3
LONDON--(BUSINESS WIRE)-- FORM 8.3 PUBLIC OPENING POSITION DISCLOSURE/DEALING DISCLOSURE BY A PERSON WITH INTERESTS IN RELEVANT SECURITIES REPRESENTING 1% OR MORE Rule 8.3 of the Takeover Code (the “Code”) 1. KEY INFORMATION (a) Full name of discloser: NATIXIS SA (b) Owner or controller of interests and short positions disclosed, if different from 1(a): The naming of nominee or vehicle companies is insufficient. For a trust, the trustee(s), settlor and beneficiaries must be named. (c) Name o...
-
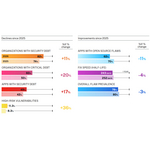
Veracode 2026 State of Software Security Report Reveals Four Out of Five Organizations Are Drowning in Security Debt
BURLINGTON, Mass.--(BUSINESS WIRE)--Veracode’s 2026 State of Software Security Report reveals 82% of organizations now harbor security debt—an 11% increase from the prior year....
-
NATIXIS UK Regulatory Announcement: Form 8.3
LONDON--(BUSINESS WIRE)-- FORM 8.3 PUBLIC OPENING POSITION DISCLOSURE/DEALING DISCLOSURE BY A PERSON WITH INTERESTS IN RELEVANT SECURITIES REPRESENTING 1% OR MORE Rule 8.3 of the Takeover Code (the “Code”) 1. KEY INFORMATION (a) Full name of discloser: NATIXIS SA (b) Owner or controller of interests and short positions disclosed, if different from 1(a): The naming of nominee or vehicle companies is insufficient. For a trust, the trustee(s), settlor and beneficiaries must be named. (c) Name o...
-
First Trust Global Funds PLC UK Regulatory Announcement: Net Asset Value(s)
LONDON--(BUSINESS WIRE)-- Funds Date TIDM ISIN Code Shares in Issue Currency Net Asset Value NAV/per Share First Trust US Equity Income UCITS ETF 23.02.2026 UINC IE00BZBW4Z27 9,861,191.00 USD 373,992,155.45 37.926 ...
-
NATIXIS UK Regulatory Announcement: Form 8.3
LONDON--(BUSINESS WIRE)-- FORM 8.3 PUBLIC OPENING POSITION DISCLOSURE/DEALING DISCLOSURE BY A PERSON WITH INTERESTS IN RELEVANT SECURITIES REPRESENTING 1% OR MORE Rule 8.3 of the Takeover Code (the “Code”) 1. KEY INFORMATION (a) Full name of discloser: NATIXIS SA (b) Owner or controller of interests and short positions disclosed, if different from 1(a): The naming of nominee or vehicle companies is insufficient. For a trust, the trustee(s), settlor and beneficiaries must be named. (c) Name o...
-
First Trust Global Funds PLC UK Regulatory Announcement: Net Asset Value(s)
LONDON--(BUSINESS WIRE)-- Funds Date TIDM ISIN Code Shares in Issue Currency Net Asset Value NAV/per Share First Trust Capital Strength UCITS ETF 23.02.2026 FTCS. IE00BL0L0D23 275,002.00 USD 9,303,283.33 33.830 ...
-
First Trust Global Funds PLC UK Regulatory Announcement: Net Asset Value(s)
LONDON--(BUSINESS WIRE)-- Funds Date TIDM ISIN Code Shares in Issue Currency Net Asset Value NAV/per Share First Trust Emerging Markets AlphaDEX UCITS ETF 23.02.2026 FEM IE00B8X9NX34 325,002.00 USD 15,517,449.53 47.746 ...
-
American Beacon Advisors and DoubleLine Capital Further Their Partnership to Create Greater Access to DoubleLine’s Investment Acumen for the Wealth Channel
IRVING, Texas--(BUSINESS WIRE)--American Beacon acquires DoubleLine Select Income Fund; merges DoubleLine Floating Rate Fund with the American Beacon DoubleLine Floating Rate Fund....
-
First Trust Global Funds PLC UK Regulatory Announcement: Net Asset Value(s)
LONDON--(BUSINESS WIRE)-- Funds Date TIDM ISIN Code Shares in Issue Currency Net Asset Value NAV/per Share First Trust Value Line Dividend Index UCITS ETF 23.02.2026 FVD. IE00BKVKW020 250,002.00 USD 7,506,754.08 30.027 ...