

Newsroom
Sorted by: Latest
-
オアシス、日本のM&Aにおける実質的な公正性の必要性を示す、シダックス事件に関する東京地裁の重要な決定を歓迎
香港--(BUSINESS WIRE)--(ビジネスワイヤ) -- オアシス・マネジメント・カンパニー・リミテッド(以下「オアシス」)は、2024年に完了したシダックス株式会社(以下「シダックス」)の非公開化取引を受け、オアシスが運用するファンドが申し立てた株式買取価格決定申立事件において、シダックス株式について公開買付価格を上回る公正な価格を定めた東京地方裁判所の2026年7月23日付決定を歓迎します。裁判所は、1株当たり800円の公開買付価格を公正な価格として採用することはできないとし、1株当たり950円を公正な価格と定めています。 本決定は、同じくオアシスが運用するファンドが申立人となったファミリーマート事件に続き、二段階買収による非公開化取引において、特別委員会による検討及び交渉の実質を詳細に審査した上で、公正性担保措置が十分ではなかったと裁判所が判断した国内2件目の事例と理解しています。ファミリーマート事件と同様、本件でも、取引の検討及び交渉のために設置された特別委員会が独立して行動し、少数株主の利益を最優先に、実質的な保護を図っていたかが焦点となりました。 本決定は、オア...
-
Oasis Welcomes Significant SHiDAX Decision Affirming the Need for Substantive Fairness in Japanese M&A
HONG KONG--(BUSINESS WIRE)--Oasis Management Company Ltd. ("Oasis") welcomes the Tokyo District Court's decision, delivered on July 23, 2026, determining a higher fair value for shares of SHiDAX Corporation ("SHiDAX"), in a share purchase price determination proceeding brought by funds managed by Oasis following SHiDAX's going private transaction completed in 2024. The Court found that the JPY 800 tender offer price could not be treated as fair and instead set the fair price at JPY 950 per shar...
-
KKR and Mirastar Complete Acquisition of Portfolio of Four Prime UK Logistics Assets from PLP
LONDON--(BUSINESS WIRE)--KKR and Mirastar, KKR Real Estate’s industrial and logistics platform in Europe, have announced the acquisition of a portfolio of four prime UK logistics assets from PLP for approximately £170 million, totalling 1.25 million square feet. The portfolio comprises assets in Stafford, Crewe, Ellesmere Port and Wakefield, all located within established logistics markets across the West Midlands, the North West and Yorkshire. The assets provide best-in-class specifications co...
-
Computershare Trustees (Jersey) Limited UK Regulatory Announcement: Form 8.3
LONDON--(BUSINESS WIRE)-- FORM 8.3 PUBLIC OPENING POSITION DISCLOSURE/DEALING DISCLOSURE BY A PERSON WITH INTERESTS IN RELEVANT SECURITIES REPRESENTING 1% OR MORE Rule 8.3 of the Takeover Code (the “Code”) 1. KEY INFORMATION (a) Full name of discloser: Computershare Trustees (Jersey) Limited as trustee of the Schroders Employee Benefit Trust (b) Owner or controller of interests and short positions disclosed, if different from 1(a): The naming of nominee or vehicle companies is insufficient. Fo...
-
KBRA Releases Research – KBRA-Rated European RMBS Exposure to Wildfires in Spain
LONDON--(BUSINESS WIRE)--KBRA releases research assessing the potential exposure of KBRA-rated European residential mortgage-backed securities (RMBS) transactions to the ongoing wildfires in Spain. Spain is confronting an exceptionally severe wildfire season, with approximately 173,000 hectares burnt from the start of the year through 28 July, nearly six times the amount recorded over the same period in 2025. The three largest documented wildfire areas included in KBRA’s review are located in A...
-
Singapur beauftragt Thales mit KI-gestütztem Flugverkehrsmanagementsystem der nächsten Generation für einen der verkehrsreichsten Lufträume Asiens
MEUDON, Frankreich--(BUSINESS WIRE)--Die Zivilluftfahrtbehörde von Singapur (CAAS) hat Thales einen bedeutenden Auftrag zur Entwicklung eines neuen NexGen-Flugverkehrsmanagementsystems (ATMS) und von Flugsicherungsradaren erteilt – ein wichtiger Schritt hin zu einem effizienteren, sichereren und nachhaltigeren Luftfahrtökosystem. Das NexGen-ATMS wird das derzeitige LORADS III-System durch die Lösung TopSky – ATC One von Thales ablösen. Das Projekt sieht außerdem einen umfassenden Wissenstransfe...

-
RHI Magnesita 2026 Half Year Results: Consistent Self-help Delivery and Strong Steel Business Performance Delivers 42% Adj. EBITA Growth on Constant Currency Basis
VIENNA--(BUSINESS WIRE)--RHI Magnesita, the leading global supplier of high-grade refractory products, systems and solutions, announces its results for the six months ended 30 June 2026. Strong earnings improvement despite continued market weakness RHI Magnesita delivered a solid earnings improvement in the first half of 2026, supported by continued execution of management-led self-help measures and strong performance in the Steel segment. Adjusted EBITA increased by €24 million, or 17%, to €16...

-
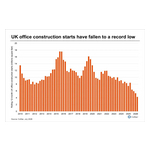
CoStar Data Shows London Dominates UK Office Development as Regional Pipeline Hits 20-Year Low
LONDON--(BUSINESS WIRE)--Office construction in UK regions has fallen to its lowest level in at least 20 years, according to data from CoStar, a global leading provider of online real estate marketplaces, information and analytics in the property markets. Preliminary data for Q2 2026 shows annual office construction starts fell below 5 million square feet for the first time since at least 2010, far below the 16 million square feet recorded in 2019, when conditions were more supportive. “The fal...
-
Mitsubishi Electric Announces Consolidated Financial Results for the First Quarter of Fiscal 2027
TOKYO--(BUSINESS WIRE)--Mitsubishi Electric Corporation (TOKYO: 6503) announced today its consolidated financial results for the first quarter, ended June 30, 2026, of the current fiscal year ending March 31, 2027 (fiscal 2027). The full document on Mitsubishi Electric’s financial results can be viewed at the following link: www.MitsubishiElectric.com/en/pr Consolidated Financial Results Billions of yen Q1 FY26 Q1 FY27 YoY Revenue 1,312.8 1,497.1 +184.2 114% Adjusted operating profit 93.8 144.3...
-
Orano: Résultats semestriels 2026 en ligne avec les perspectives annuelles malgré des arrêts de production conjoncturels
PARIS--(BUSINESS WIRE)--Regulatory News: Orano: Activité globalement stable avec des situations contrastées par secteur, EBITDA pénalisé par des arrêts de production Chiffre d’affaires de 2 696 M€, en légère progression de + 2,1 % (p.c.c.), marqué par une bonne performance du secteur Aval et un écoulement moins favorable du carnet de commandes des secteurs Mines et Amont entre les deux périodes. EBITDA en baisse à 595 M€ (contre 727 M€ au 1er semestre 2025) compte tenu d’arrêts de production da...