

Newsroom
Sorted by: Latest
-
Orijin Acquires Honest Jobs to Create the First End-to-End Education-to-Employment Pathway for Justice-Involved Individuals in the U.S.
NEW YORK--(BUSINESS WIRE)--Orijin, a national leader in correctional education and workforce development technology, today announced the acquisition of Honest Jobs, a national fair-chance employment platform connecting formerly incarcerated individuals with job opportunities and reentry resources. The acquisition unites Orijin’s education, rehabilitation, and workforce preparation platform with Honest Jobs’ national employer network and reentry technology, creating the only comprehensive end-to...
-
Graham Holdings Company Declares Regular Quarterly Dividend
ARLINGTON, Va.--(BUSINESS WIRE)--Graham Holdings Company (NYSE: GHC) today declared a regular quarterly dividend of $1.88 per share, payable on May 7, 2026, to shareholders of record on April 16, 2026....
-
Addus HomeCare to Participate in the Raymond James & Associates 47th Annual Institutional Investors Conference
FRISCO, Texas--(BUSINESS WIRE)--Addus HomeCare Corporation (Nasdaq: ADUS), a provider of home care services, today announced that management will participate in the Raymond James & Associates 47th Annual Institutional Investors Conference, which takes place March 1 – 4, 2026, in Orlando, Florida. In connection with the conference, there will be a live broadcast and replay of the Company’s presentation available under the Investor Relations section of the Company’s website, www.addus.com, st...
-
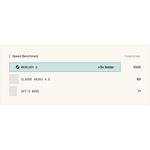
Inception Launches Mercury 2, the Fastest Reasoning LLM — 5x Faster Than Leading Speed-Optimized LLMs, with Dramatically Lower Inference Cost
PALO ALTO, Calif.--(BUSINESS WIRE)--Inception, the company behind the first commercial diffusion large language models (dLLMs), today announced the launch of Mercury 2, the fastest reasoning LLM and first reasoning dLLM. Mercury 2 delivers 5x faster performance while reducing the latency and cost barriers that have limited real‑world deployment of reasoning systems. Mercury 2 models are available today via the Inception API. Every major LLM in production today, including GPT, Claude, and Gemini...
-
The Invention Network Launches First Company With New Revenue-Sharing Model
DENVER--(BUSINESS WIRE)--Today, The Invention Network launched as a new type of holding network that builds companies in the world’s largest, most extractive markets and pays 50% of its revenue directly to its contributors. Founded by six-time founder Alan Curtis and with initial backers including Ted Breyer, Partner at Breyer Capital; Jerry Yang, Co-Founder of Yahoo; Anne Wojcicki, Founder of 23andMe; Joe Dowling, Global Head of Multi-Asset Investing at Blackstone; and founders of Circle, Open...
-
Symetra Enhances Fixed Indexed Annuities, Introduces New Franklin Large Cap Value 15% ER Index
BELLEVUE, Wash.--(BUSINESS WIRE)--Symetra is introducing enhancements to its suite of fixed indexed annuities, including the addition of new Franklin Large Cap Value 15% ER Index....
-
Community Health Systems to Participate in Upcoming Investor Conferences in March
FRANKLIN, Tenn.--(BUSINESS WIRE)--Community Health Systems, Inc. (NYSE:CYH) today announced that management will participate at the following investor conferences in March: - J.P. Morgan 2026 Global Leveraged Finance Conference to be held on March 2-4, 2026. The presentation will begin at 9:30 a.m. Eastern time, 8:30 a.m. Central time on Tuesday, March 3, 2026. - Barclays 28th Annual Global Healthcare Conference to be held on March 10 - 12, 2026. The fireside chat presentation will begin at 3:0...
-
Openly Partners With claimtouch to Automate Personal Property Claims Valuation
NEW YORK--(BUSINESS WIRE)--Openly, a tech-driven premium insurance provider, announced a partnership with CLAIMTOUCH ANALYTICS INC. (“claimtouch”), an AI-native insurtech providing an end-to-end solution for personal property claims. This partnership is designed to reduce settlement times for content claims by automating the pricing and valuation of damaged personal property. Through the integration of claimtouch's Personal Property Platform with Openly’s claims management system, adjusters can...
-
CHG Healthcare Foundation Celebrates 10th Anniversary With $1 Million Given in 2025 and $6 Million Donated to Date
MIDVALE, Utah--(BUSINESS WIRE)--The CHG Healthcare Foundation is celebrating its 10th anniversary with a major milestone: $1 million in community grants awarded in 2025, placing it among the top 8% of U.S. nonprofit grant makers. Since its launch in 2016, the Foundation has provided $6 million in funding to nonprofit partners and supported more than 400 healthcare providers on 350 medical missions across 30 countries worldwide. The Foundation’s employee‑driven model channels funding to nonprofi...
-
Verdiva Bio Announces Completion of Enrollment for EVOLVE-2 Phase 2b Study of VRB-101, a Potential Once-Weekly Oral GLP-1 Peptide Analog in Individuals with Obesity
LONDON & SAN FRANCISCO--(BUSINESS WIRE)--Verdiva Bio announces completion of enrollment for EVOLVE-2 Phase 2b study of VRB-101...