Newsroom
Sorted by: Latest
-
Azafaros Announces Publication of Phase 2 RAINBOW Study Data for Nizubaglustat in Molecular Genetics and Metabolism Journal
LEIDEN, Netherlands--(BUSINESS WIRE)--Azafaros, a private company building a portfolio to become a leader in lysosomal storage disorders (LSDs), focused on addressing neurological symptoms, today announced the publication of clinical data from its Phase 2 (RAINBOW) study in the peer reviewed journal, Molecular Genetics & Metabolism. The published manuscript reports efficacy, safety, pharmacokinetic and pharmacodynamic data which evaluated nizubaglustat in patients with genetically confirmed...
-
Motive Announces 2026 Visionary Customer Award Winners at Vision 26
NASHVILLE, Tenn.--(BUSINESS WIRE)--Motive, the AI platform for physical operations, today recognized the outstanding achievements of its customers with the announcement of its 2026 Motive Visionary Customer Award winners. Unveiled live at Vision 26, Motive’s third annual innovation summit, the awards recognize industry leaders that leveraged the Motive platform to deliver extraordinary, measurable results that make their operations safer, more productive, and more profitable. Meet the 2026 Moti...

-
Omdia:2025年全球網路影音訂閱量達22.4億,2026年增速預計將放緩
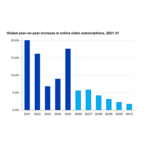
倫敦--(BUSINESS WIRE)--(美國商業資訊)-- 根據Omdia的最新電視與影音市場數據顯示,截至2025年底,全球網路影音訂閱量已達到22.4億,較2024年同期的19億成長17.6%。然而,隨著市場進入更趨成熟的階段,預計2026年的成長率將放緩至個位數。與此同時,全球付費電視訂閱量繼續呈現漸進式下滑,較去年同期下降1.8%至10.3億。全球電視與影音市場的格局持續向串流媒體傾斜,在全線33億的總訂閱量中,網路影音的佔有率為68.4%。 在收入方面,網路影音在2025年首次超越付費電視。網路影音收入成長13.5%至1760億美元,而付費電視收入則下降4%至1700億美元。上述兩項數據均包含會員訂閱和單點付費收入,但均不包含廣告收入。 Omdia的全球數據顯示,在其追蹤的各個市場中,地方層面正呈現出多元化的發展趨勢。然而,一個核心的共同主題是:新的、價格更低的廣告支援套餐正在持續吸引新用戶加入網路影音領域。 Omdia媒體、娛樂與廣告團隊業務主管Adam Thomas表示:「2025年訂閱量17.6%的增幅創下自2021年以來的最大年成長率。這一成長尤其受到了電信營運商...

-
Omdia:2025年在线视频订阅用户数达到22.4亿,2026年增长预计放缓
伦敦--(BUSINESS WIRE)--(美国商业资讯)-- Omdia最新电视和视频市场数据,全球在线视频订阅用户在2025年底达到22.4亿,较2024年的19亿同比增长17.6%。不过,随着市场逐渐进入成熟阶段,预计2026年增长将放缓至个位数水平。与此同时,全球付费电视订阅量继续缓慢下滑,同比下降1.8%至10.3亿。全球电视与视频市场结构持续向流媒体倾斜,在线视频已占全球总订阅量(33亿)的68.4%。 在收入方面,在线视频在2025年首次超越付费电视。在线视频收入同比增长13.5%至1760亿美元,而付费电视收入下降4%至1700亿美元。上述数据均包含订阅与交易收入,但不包括广告收入。 Omdia全球数据显示,其所追踪的各个市场在本地层面呈现出多样化趋势,但其中一个共同主题是:新兴的价格低但有一定广告内容的会员订阅包正在吸引更多用户进入在线视频领域。 Omdia媒体、娱乐与广告团队业务负责人Adam Thomas表示:“2025年订阅用户增长17.6%,是自2021年以来的最大年度增幅。这一增长主要由电信运营商和付费电视运营商提供的补贴型广告订阅服务推动。正是这些低价方案...

-
Motha Descends on NYC: Grindr and Madonna Team up for Legendary Times Square Performance
NEW YORK--(BUSINESS WIRE)--Tonight, Grindr, the Global Gayborhood in Your Pocket (NYSE: GRND), and Madonna made history. In front of a record-breaking crowd, Madonna delivered an electrifying live performance giving the world its first taste of three new tracks from Confessions II – available everywhere July 3 via Warner Records. Just thirty minutes after announcing the surprise show in the Grindr app, Madonna took over Times Square, stepping onto stage wearing a Dolce & Gabbana corset and...

-
GRINDR E MADONNA SE UNEM PARA PERFORMANCE LENDÁRIA NA TIMES SQUARE
NOVA YORK--(BUSINESS WIRE)--Esta noite, o Grindr, o Global Gayborhood in Your Pocket (NYSE: GRND), e Madonna fizeram história. Diante de um público recorde, Madonna entregou uma performance eletrizante, dando ao mundo a primeira amostra de três faixas inéditas de Confessions II – disponível em todas as plataformas em 3 de julho via Warner Records. Apenas trinta minutos após o anúncio do show surpresa no aplicativo do Grindr, Madonna dominou a Times Square, subindo ao palco vestindo um espartilh...

-
MADRE ATERRIZA SOBRE NUEVA YORK: GRINDR Y MADONNA SE UNEN PARA UNA NOCHE LEGENDARIA EN TIMES SQUARE
NUEVA YORK--(BUSINESS WIRE)--Esta noche, Grindr, el Global Gayborhood in Your Pocket (NYSE: GRND), y Madonna hicieron historia. Ante una multitud histórica, Madonna prendió Times Square con una actuación en vivo donde el mundo escuchó por primera vez tres nuevas canciones de Confessions II – disponible en todas las plataformas digitales el 3 de julio vía Warner Records. Apenas treinta minutos después de anunciar el show sorpresa en la app de Grindr, Madonna se apoderó de Times Square, subiendo...

-
オムディア(Omdia)、2025年のオンライン動画サブスクリプションの加入者数は22億4,000万人に到達した一方、2026年は成長鈍化を予測と発表
ロンドン--(BUSINESS WIRE)--(ビジネスワイヤ) -- オムディア(Omdia)の最新のTV・動画市場データによると、世界のオンライン動画配信サービス契約数は2025年末時点で22億4,000万人に達し、2024年の19億人から前年比17.6%増加した。しかし、市場が成熟期に入るにつれ、2026年には成長率が一桁台に減速すると予測。一方、世界の有料テレビ加入者数は引き続き緩やかに減少しており、前年比1.8%減の10億3,000万件となった。世界のテレビ・動画市場は引き続きストリーミングへと軸足を移しており、オンライン動画は世界全体の加入者数33億人の68.4%を占めている。 売上高の面では、2025年にオンライン動画が有料TVを初めて上回りました。オンライン動画の売上高は13.5%増の1,760億ドルとなった一方、有料TVの売上高は4%減の1,700億ドルに留まっています。いずれの数値も、サブスクリプション収入と課金収入を含んでいますが、広告収入は含まれていません。 収益面での歴史的転換点 収益面では、2025年にオンライン動画が初めて有料テレビを上回った。オンライン...
-
Tsuno Rice Fine Chemicals: un estudio comparativo de absorción del producto derivado del salvado de arroz Rice Magnesium revela nueva información útil sobre su perfil de absorción gradual y sostenida
WAKAYAMA, Japón--(BUSINESS WIRE)--Tsuno Rice Fine Chemicals Co., Ltd. anunció los resultados de un estudio interno realizado en humanos que demuestran que su ingrediente patentado derivado del salvado de arroz, “Rice Magnesium“, proporciona una absorción gradual y sostenida de magnesio en comparación con otras fuentes de magnesio. Los resultados sugieren posibles beneficios para el mantenimiento del sueño, el control de la fatiga muscular durante el ejercicio prolongado y una mejor tolerancia d...

-
FPT and ComfortDelGro to Explore Smart Mobility and Digital Innovation Across APAC
SINGAPORE--(BUSINESS WIRE)--Global technology corporation FPT and ComfortDelGro (CDG), a leading multi-modal transport operator, have signed a Memorandum of Understanding to explore collaboration in artificial intelligence, smart mobility, and logistics and transport, with a shared focus on advancing AI-powered operations and next-generation mobility solutions across the APAC region. Under the agreement, both companies will explore opportunities in a broad range of strategic areas, including AI...