

Newsroom
Sorted by: Latest
-
JCÖNTENTS:「即使語言不通,也能輕鬆到達目的地」
日本京都--(BUSINESS WIRE)--(美國商業資訊)-- JCÖNTENTS於6月1日發布免費GOPin智慧型手機應用程式! JCÖNTENTS Co., Ltd.(京都府;代表:Takamasa Yoshimitsu)於6月1日發布免費GOPin智慧型手機應用程式! GOPin是一款全新的多語言導航應用,透過二維碼為赴日遊客提供當地計程車服務。使用者只需在地圖上選擇目的地並出示二維碼,計程車司機掃描後即可在Google地圖上立即顯示精準路線。 從此告別輸入地址和語言不通的煩惱。 GOPin無需註冊,完全免費使用。 致赴日遊客 告別語言障礙,只需向計程車司機出示您的智慧型手機! 多語言地圖功能:*可顯示英文、日文、中文(正體、簡體)和韓文。 用您最熟悉的語言輕鬆找到目的地。 一鍵產生二維碼:只需在目的地放置圖釘,即可立即產生專屬二維碼。 離線也能輕鬆出行:只需在螢幕上顯示產生的二維碼,無需任何語言交流。 GOPin官方網站:https://www.gopin.jp/ 免責聲明:本公告之原文版本乃官方授權版本。譯文僅供方便瞭解之用,煩請參照原文,原文版本乃唯一具法律效力之版本。...

-
JCÖNTENTS“即使存在语言障碍,也能轻松抵达目的地。”
日本京都--(BUSINESS WIRE)--(美国商业资讯)-- JCÖNTENTS于6月1日推出免费GOPin智能手机应用程序! JCÖNTENTS Co., Ltd.(京都府;代表:Takamasa Yoshimitsu)于6月1日发布了面向智能手机的免费应用程序GOPin! GOPin是一款全新的多语言导航应用,通过二维码将到访日本的游客与当地出租车司机连接起来。用户只需在地图上选择目的地并出示二维码,出租车司机扫描后,Google地图便会立即显示精确的路线。 再也不用担心输入地址或发音问题。 GOPin无需用户注册,且可免费使用。 适用于访日游客 告别语言障碍——只需把智能手机给出租车司机看一下! 多语言地图功能:*支持英语、日语、中文(繁体、简体)和韩语。 轻松用您最熟悉的语言找到目的地。 一键生成二维码:只需在目的地标记一个位置,即可立即生成唯一的二维码。 即使离线也能轻松应对:只需在屏幕上显示生成的二维码,无需任何沟通。 GOPin官方网站: https://www.gopin.jp/ 免责声明:本公告之原文版本乃官方授权版本。译文仅供方便了解之用,烦请参照原文,原文版...

-
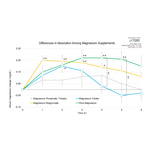
Riassunto: Tsuno Rice Fine Chemicals: studio comparativo sull'assorbimento del "Rice Magnesium" derivato dalla crusca di riso fornisce nuove indicazioni sul suo profilo di assorbimento graduale e prolungato
WAKAYAMA, Giappone--(BUSINESS WIRE)--Tsuno Rice Fine Chemicals Co., Ltd. ha annunciato i risultati di uno studio interno sugli esseri umani che ha dimostrato come il suo ingrediente proprietario derivato dalla crusca di riso, "Rice Magnesium" sia in grado di garantire un assorbimento graduale e continuo di magnesio rispetto al altre fonti di magnesio. I risultati suggeriscono benefici potenziali per un migliore riposo, la gestione dell'affaticamento muscolare durante l'esercizio fisico prolunga...
-
Pershing Square Holdings, Ltd. UK Regulatory Announcement: Transaction in Own Shares
LONDON--(BUSINESS WIRE)-- Pershing Square Holdings, Ltd. Announces Transactions in Own Shares - 4 June 2026 Pershing Square Holdings, Ltd. (LN:PSH) (LN:PSHD) (“PSH”) today announced that it has purchased, through PSH’s agent, Jefferies International Limited (“Jefferies”), the following number of PSH’s Public Shares of no par value (ISIN Code: GG00BPFJTF46) (the "Shares"): Total Buyback Ticker/s: PSH (LSE); PSHD (LSE) Date of Purchase: 4 June 2026 Number of Public Shares Purchased: 24,499 Sha...
-
Deutsche Bank AG UK Regulatory Announcement: FRN Variable Rate Fix
LONDON--(BUSINESS WIRE)-- City of Stockholm SEK 1,300,000,000.00 MTN Floating Rate Notes due September 2028 Series EMTN95 Tranche 1 MTN ISSUE NAME. Our Ref. MQ0239 ISIN Code. XS2677615150 TOTAL INTEREST AMT. CURRENCY CODE. SEK DAY BASIS. Actual/360 (A004) NUM OF DAYS. 91 INTEREST RATE. 2.774 PCT VALUE DATE. 07/09/2026 INTEREST PERIOD. 08/06/2026 TO 07/09/2026 SEK 9,115,672.22 POOL FACTOR. N/A...
-
Deutsche Bank AG UK Regulatory Announcement: FRN Variable Rate Fix
LONDON--(BUSINESS WIRE)-- Commonwealth Bank of Australia Issue of GBP 375,000,000.00 Floating Rate Notes due September 2026 Series No 6694 Tranche 1 MTN ISSUE NAME. Our Ref. MU3051 ISIN Code. XS3178868025 TOTAL INTEREST AMT. CURRENCY CODE. GBP DAY BASIS. ACTUAL/365 FIXED (A005) NUM OF DAYS. 92 INTEREST RATE. 4.08675 PCT VALUE DATE. 11/06/2026 INTEREST PERIOD. 11/03/2026 TO 11/06/2026 GBP 3,862,818.49 POOL FACTOR. N/A...
-
Deutsche Bank AG UK Regulatory Announcement: FRN Variable Rate Fix
LONDON--(BUSINESS WIRE)-- City of Stockholm Issue of NOK 1,500,000,000 Floating Rate Notes due December 2026 Series EMTN 89 Tranche 1 MTN ISSUE NAME. Our Ref. MO2528 ISIN Code. XS2418404765 TOTAL INTEREST AMT. CURRENCY CODE. NOK DAY BASIS. Actual/360 (A004) NUM OF DAYS. 91 INTEREST RATE. 5.61 PCT VALUE DATE. 07/09/2026 INTEREST PERIOD. 08/06/2026 TO 07/09/2026 NOK 21,271,250 POOL FACTOR. N/A...
-
Getlink: Shuttle Traffic in May 2026
PARIS--(BUSINESS WIRE)--Regulatory News: Getlink (Paris:GET): In May, LeShuttle Freight carried 95,641 trucks, down 2% compared to May 2025. Since 1 January, close to 490,000 trucks have crossed the Channel on board the Shuttles. LeShuttle carried 203,872 passenger vehicles in May, up 4% compared to May 2025. More than 750,000 passenger vehicles have been transported since 1 January. May 26 May 25 Change Jan.-May 2026 Jan.-May 2025 Change Truck Shuttles Trucks 95,641 97,125 -2% 487,225 498...
-
Getlink: Trafics Navettes du mois de mai 2026
PARIS--(BUSINESS WIRE)--Regulatory News: Getlink (Paris:GET): En mai, LeShuttle Freight a transporté 95 641 camions, soit une baisse de 2% par rapport à mai 2025. Depuis le 1er janvier, ce sont près de 490 000 camions qui ont traversé la Manche à bord des Navettes. LeShuttle a transporté 203 872 véhicules de tourisme au mois de mai, en hausse de 4% par rapport à mai 2025. Plus de 750 000 véhicules de tourisme ont ainsi été transportés depuis le 1er janvier. Mai 26 Mai 25 Variation Jan.-Mai...
-
YOUNG & CO'S BREWERY PLC UK Regulatory Announcement: Transaction in Own Shares
LONDON--(BUSINESS WIRE)-- 05 June 2026 YOUNG & CO.’S BREWERY, P.L.C. Transaction in own shares Young & Co.’s Brewery, P.L.C. (the “Company”) announces that between 29 May – 04 June 2026, in accordance with the terms of its share buyback programme announced by the Company on 17 November 2025 (the “Share Buyback Programme”), it has purchased the following Non-voting ordinary shares of 12.5 pence each (“Non-voting Shares” and the “Purchased Shares”) in the Company through Stifel Nicolaus...