

Newsroom
Sorted by: Latest
-
Corning Announces Quarterly Dividend
CORNING, N.Y.--(BUSINESS WIRE)--Corning Incorporated’s (NYSE: GLW) Board of Directors today declared a quarterly dividend of $0.28 per share. The dividend will be payable on September 29, 2026, to shareholders of record on August 31, 2026. Caution Concerning Forward-Looking Statements The statements contained in this release and related comments by management that are not historical facts or information and contain words such as “will,” “believe,” “anticipate,” “expect,” “intend,” “plan,” “seek...
-
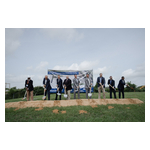
Grundfos Breaks Ground on Americas Campus Expansion to Support Growing U.S. Demand
BROOKSHIRE, Texas--(BUSINESS WIRE)--Grundfos announced the groundbreaking of a production expansion at its Brookshire campus located west of Houston....
-
Catalyst Pharmaceuticals Investor Alert: Kahn Swick & Foti, LLC Investigates Adequacy of Price and Process in Proposed Sale of Catalyst Pharmaceuticals, Inc. - CPRX
NEW YORK CITY & NEW ORLEANS--(BUSINESS WIRE)--Former Attorney General of Louisiana Charles C. Foti, Jr., Esq. and the law firm of Kahn Swick & Foti, LLC (“KSF”) are investigating the proposed sale of Catalyst Pharmaceuticals, Inc. (NasdaqCM: CPRX) to Angelini Pharma S.p.A. Under the terms of the proposed transaction, shareholders of Catalyst will receive $31.50 in cash for each share of Catalyst that they own. KSF is seeking to determine whether this consideration and the process that led t...

-
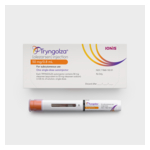
TRYNGOLZA® (olezarsen) approved by the FDA as the first and only treatment to reduce triglycerides and the risk of acute pancreatitis in patients with severe hypertriglyceridemia (sHTG)
CARLSBAD, Calif.--(BUSINESS WIRE)--Ionis Pharmaceuticals, Inc. (Nasdaq: IONS) today announced that the U.S. Food and Drug Administration (FDA) has approved TRYNGOLZA® (olezarsen) as an adjunct to diet to reduce triglycerides (TG) and the risk of acute pancreatitis in adults with severe hypertriglyceridemia (sHTG: TG greater than or equal to 500 mg/dL). TRYNGOLZA is available in a 50 mg or 80 mg dose and is self-administered once monthly via an autoinjector. sHTG is characterized by an increased...
-
OpenVC™ Announces Close of OPEN Unicorn Fund, Expanding Access to Private Market Leaders
NEW YORK--(BUSINESS WIRE)--OpenVC announces successful close of the OPEN Unicorn Fund; firm continues to broaden access to world’s most influential privately held companies....
-
アルダーバック・エナジー、サンディエゴ・スーパーコンピューター・センターに800V DCソリッドステートトランスフォーマープラットフォームを導入
サンディエゴ--(BUSINESS WIRE)--(ビジネスワイヤ) -- アルダーバック・エナジーは、同社のNexus Power Unit™(NPU)をカリフォルニア大学サンディエゴ校(UCサンディエゴ)のサンディエゴ・スーパーコンピューター・センター(SDSC)に導入すると発表しました。NPUは最先端の中電圧ソリッドステートトランスフォーマー(SST)プラットフォームであり、複数の資産と複雑な電力の流れを連携して管理できる次世代スマートグリッドの実現に貢献します。今回の導入は、カリフォルニアエネルギー委員会(CEC)の資金提供を受けたプロジェクト「カリフォルニアにおけるグリッド連携型フレキシブルデータセンターの加速化」の一環であり、データセンターにおけるAIラック密度の増加、電力系統の複雑化、グリッド連携要件への対応を支援するために設計された12kV AC-800V DCアーキテクチャの運用に関するフィールドデータを生成します。 AI向けインフラの導入における最大の障害はよく知られており、電力供給までの時間、設置面積、電力システムの複雑さ、稼働リスク、サプライチェーンの問題、そ...
-
Resumen: Grid Dynamics reunió a los líderes tecnológicos de los mercados de capitales en el XT26 para analizar la volatilidad de la IA en los servicios financieros
SAN RAMÓN, California--(BUSINESS WIRE)--Grid Dynamics Holdings, Inc. (Nasdaq: GDYN) ("Grid Dynamics"), empresa especializada en procesos de transformación impulsados por IA para compañías de la lista Fortune 1000, celebró el XT26. El foro, dirigido exclusivamente a invitados, reunió en el Tower Hill de Londres a más de 250 altos directivos tecnológicos de los sectores bancario, de fondos de cobertura y de mercados de capitales. El comunicado en el idioma original es la versión oficial y autoriz...

-
Grid Dynamics veranstaltete die XT26 und brachte führende Vertreter der Kapitalmarkttechnologie zusammen, um über die Volatilität der KI im Finanzdienstleistungssektor zu diskutieren
SAN RAMON, Kalifornien--(BUSINESS WIRE)--Grid Dynamics Holdings, Inc. (Nasdaq: GDYN) („Grid Dynamics“), ein führender Partner für die KI-Transformation der Fortune-1000-Unternehmen, veranstaltete die XT26. Die Konferenz, die ausschließlich auf Einladung stattfand, versammelte über 250 hochrangige Führungskräfte aus den Bereichen Bankwesen, Hedgefonds und Kapitalmärkte im Tower Hill in London. Die XT-Konferenzreihe, die nun bereits zum zehnten Mal stattfand, hat sich zu einem der angesehensten F...
-
Samenvatting: Grid Dynamics organiseerde XT26, een bijeenkomst van toonaangevende spelers op het gebied van kapitaalmarkttechnologie rond het thema 'de volatiliteit van AI in de financiële dienstverlening'
SAN RAMON, Calif.--(BUSINESS WIRE)--Grid Dynamics Holdings, Inc. (Nasdaq: GDYN) ("Grid Dynamics"), een toonaangevende partner op het gebied van AI-transformatie voor de Fortune 1000, organiseerde XT26. De conferentie was alleen op uitnodiging en bracht meer dan 250 vooraanstaande technologische leiders uit de bankwereld, de hedgefondsensector en de kapitaalmarkten samen in Tower Hill, Londen. Deze bekendmaking is officieel geldend in de originele brontaal. Vertalingen zijn slechts als leeshulp...

-
Grid Dynamics a organisé l'événement XT26, qui a réuni les leaders du secteur des technologies des marchés de capitaux autour du thème de la volatilité de l'IA dans les services financiers
SAN RAMON, Calif.--(BUSINESS WIRE)--Grid Dynamics Holdings, Inc. (Nasdaq : GDYN) (« Grid Dynamics »), partenaire de premier plan en matière de transformation par l’IA pour les entreprises du classement Fortune 1000, a organisé la conférence XT26. Cet événement sur invitation a réuni plus de 250 responsables technologiques de haut niveau issus du secteur bancaire, des fonds spéculatifs et des marchés de capitaux à Tower Hill, à Londres. La série de conférences XT, qui en est désormais à sa 10e é...
