

Newsroom
Sorted by: Latest
-
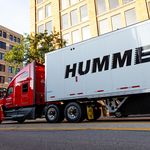
Don Hummer Trucking Named 2026 TCA Elite Fleet Certified Carrier for Second Consecutive Year
CEDAR RAPIDS, Iowa--(BUSINESS WIRE)--Don Hummer Trucking is proud to announce it has been recognized as a 2026 TCA Elite Fleet Certified Carrier by the Truckload Carriers Association (TCA), marking the company’s second consecutive year earning this distinction. The TCA Elite Fleet Program, now in its second year, recognizes North American truckload carriers that demonstrate excellence in driver experience, safety culture, operational performance, and workplace quality. The certification process...
-
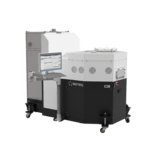
キンコーオプティカル株式会社、XRグラス向け高性能AR導波管の量産にBeneq C2R™を採用
台中(台湾)--(BUSINESS WIRE)--(ビジネスワイヤ) -- アジアを代表するODMであるキンコー・オプティカル(キンコー)は、べネックのC2R™プラズマ強化空間ALDシステムを導入することを発表しました。これにより、キンコーはパートナー企業向けに、回折導波管上に高屈折率で低損失のギャップフィリング光学コーティングの量産が可能になります。 エクステンデッド リアリティ(XR)分野は、XRグラスなどのコンシューマーエレクトロニクスにおける没入型AR体験に対する需要に支えられ、急速な成長を遂げています。近年では、世界をリードするテクノロジー企業やOEM(相手先ブランド製造)による大規模投資とイノベーションが生まれています。XRグラスの中核となるのは、デジタル画像を現実世界にシームレスに重ね合わせるために不可欠なAR向け導波路です。この最適な性能を実現するため、先進表面レリーフ グレーティング(SRG+)とナノ インプリント リソグラフィー(NIL)技術が、コンシューマー向けアプリケーションの性能、生産、コスト要件を満たす主要なプラットフォームとなっています。 ただし、これら...

-
CUPE Alberta calls for an election, says Smith’s referendum is a dangerous distraction from government’s mismanagement of public services
EDMONTON, AB--(BUSINESS WIRE)--CUPE Alberta is condemning Premier Danielle Smith’s announcement of an anti-immigrant referendum that seeks permission for her government to make it harder for Albertans to vote. “She should get back to work and focus on the issues that actually matter to Albertans,” said CUPE Alberta President Raj Uppal. “Albertans are facing actual crises in health care, in our classrooms, with the cost of living, and with jobs. Instead of taking accountability and fixing any of...
-
MaxLinear Announces New Employee Inducement Grants
CARLSBAD, Calif.--(BUSINESS WIRE)--MaxLinear announces new employee inducement equity award grants...
-
Kinko Optical Co., Ltd.選用Beneq C2R™擴大應用高性能AR波導於XR眼鏡
台灣,台中--(BUSINESS WIRE)--(美國商業資訊)-- 首屈一指的亞洲原始設備製造商Kinko Optical Co., LTD.(中文名:今國光學工業股份有限公司,以下簡稱「Kinko」)宣布選用Beneq的C2R™等離子體增強空間原子層沉積系統。此舉提高Kinko實力,將能夠為其合作夥伴大規模生產繞射光波導的高折射率、低損耗間隙填充光學塗層。 由於XR眼鏡等沉浸式擴增實境 (AR) 類消費性電子商品需求大增,擴展實境 (XR) 產業發展強勁。全球一流科技公司和原始設備製造商近年紛紛投入大量資金並鼓勵相關創新。AR波導是XR眼鏡的技術核心,在將數位影像無縫疊加到真實世界的過程中起著舉足輕重的作用。先進表面浮雕光柵 (SRG+) 和奈米壓印微影 (NIL) 技術能夠完成消費性應用對性能、生產和成本的要求,是目前表現最佳的領先平台。 然而,傳統鍍膜方法難以配合這些技術創造的複雜三度奈米結構,往往無法達到必要的表現。因此,能夠提升效率、亮度和耐久性的先進光學鍍膜成了一項重要替代方案,同時還可以擴大高性能產品的產量。Beneq的C2R™能夠符合這些要求、締造毫不妥協產品表現,協...
-
UBS Declares Quarterly Coupon Payment on Exchange Traded Note: AMUB
NEW YORK--(BUSINESS WIRE)--UBS Investment Bank today announced the coupon payment for the ETRACS Alerian MLP Index ETN Series B (NYSE Arca: “AMUB”), traded on the NYSE Arca. NYSE Ticker ETN Name and Prospectus Supplement* Coupon Valuation Date Ex- Date Record Date Payment Date Coupon Amount Payment Schedule Current Yield (annualized)** AMUB ETRACS Alerian MLP Index ETN Series B 2/17/26 3/2/26 3/2/26 3/10/26 $0.3202 Quarterly 5.95% * The table above provides a hyperlink to the relevant prospectu...
-
Materion Corporation to Hold Annual Shareholder’s Meeting May 7, 2026
MAYFIELD HEIGHTS, Ohio--(BUSINESS WIRE)--Materion Corporation (NYSE: MTRN) will hold its annual shareholder’s meeting (the Annual Meeting) on May 7, 2026, at 8 a.m. MT at the Asher Adams, Autograph Collection, hotel at 2 400 W, Salt Lake City, Utah. About Materion Materion Corporation is a global leader in advanced materials solutions for high-performance industries including semiconductor, industrial, aerospace & defense, energy and automotive. With nearly 100 years of expertise in special...
-
USA Compression Partners LP Announces 2025 K-1 Tax Package Availability
DALLAS--(BUSINESS WIRE)--USA Compression Partners, LP (NYSE: USAC) (“USA Compression”) today announced that its 2025 tax packages, including the Schedule K-1, are now available online and may be accessed at taxpackagesupport.com/usac. USA Compression has begun the process of mailing the 2025 tax packages to unitholders. Unitholders may also call Tax Package Support at 1-855-521-8151 or visit USA Compression’s website at usacompression.com in the Investor Relations section under Financials-K-1 I...
-
NeuroPace to Report Fourth Quarter 2025 Financial Results on March 3, 2026
MOUNTAIN VIEW, Calif.--(BUSINESS WIRE)--NeuroPace, Inc. (Nasdaq: NPCE), a medical device company focused on transforming the lives of people living with epilepsy, today announced it will report financial results for the fourth quarter of 2025 after market close on Tuesday, March 3, 2026. The company’s management will webcast a corresponding conference call beginning at 1:30 p.m. Pacific Time (4:30 p.m. Eastern Time). Investors interested in listening to the conference call may do so by accessin...
-
Savara Announces the U.S. Food and Drug Administration (FDA) Filed the MOLBREEVI* Biologics License Application (BLA) in Autoimmune Pulmonary Alveolar Proteinosis (Autoimmune PAP)
LANGHORNE, Pa.--(BUSINESS WIRE)--Savara Inc. (Nasdaq: SVRA) (the Company), a clinical-stage biopharmaceutical company focused on rare respiratory diseases, announced the FDA has filed for review the BLA for MOLBREEVI as a therapy to treat patients with autoimmune PAP. The FDA granted Priority Review with a PDUFA action date of August 22, 2026. “The FDA’s filing of the BLA marks another significant milestone for Savara and the autoimmune PAP community and brings us one step closer to a potential...