Newsroom
Sorted by: Latest
-
NextDecade Announces Timing of Second Quarter 2026 Investor Call
HOUSTON--(BUSINESS WIRE)--NextDecade Corporation (NextDecade or the Company) (NASDAQ: NEXT) announced today that it will host a conference call and webcast on Thursday, July 30, 2026, at 9:00 a.m. Eastern Time (8:00 a.m. Central Time) to discuss developments from the second quarter of 2026. The Company expects to issue an accompanying press release and presentation that day before the market opens. The press release, presentation, and webcast may be accessed through the Company’s website at htt...
-
Clean Energy to Report Second Quarter 2026 Financial Results on August 6; Conference Call to Follow at 1:30 p.m. Pacific Time
NEWPORT BEACH, Calif.--(BUSINESS WIRE)--Clean Energy Fuels Corp. (Nasdaq: CLNE) announced today it will release financial results for the second quarter of 2026 on August 6, 2026 after market close, followed by an investor conference call at 4:30 p.m. Eastern time (1:30 p.m. Pacific time). President and Chief Executive Officer of Clean Energy Clay Corbus and Chief Financial Officer Bob Vreeland will host the call. Investors interested in participating in the live call can dial 1.800.343.4136 fr...

-
ユニバーサル・オーソドンティック・ラボ、濱中僚を最高臨床責任者兼実験応用グループ責任者に任命
米カリフォルニア州ノーウォーク--(BUSINESS WIRE)--(ビジネスワイヤ) -- 米カリフォルニア州ノーウォークに本社を置く大手矯正歯科ラボであるユニバーサル・オーソドンティック・ラボ(ユニバーサル・ラボ)は、著名な矯正歯科臨床医であり教授でもある濱中僚を最高臨床責任者兼実験応用グループ責任者に任命したことを発表しました。 濱中は、矯正歯科分野における数十年にわたる臨床経験と学術的リーダーシップを有しています。矯正歯科教育と治療法の発展に大きく貢献してきたことで広く知られる濱中は、臨床戦略を主導するとともに、次世代矯正歯科ソリューションの開発と検証に特化した社内イニシアチブである実験応用グループを統括します。 濱中は、この2つの役割において、実際の臨床現場と最先端の歯科ラボ技術を結びつけ、医師、研究者、業界パートナーと緊密に連携していきます。濱中のリーダーシップにより、臨床検証の加速、患者アウトカムの向上、そしてユニバーサル・ラボの製品およびサービスポートフォリオ全体におけるイノベーションの推進が期待されます。 ユニバーサル・ラボのCEOであるジョセフ・キムは、「濱中は、...
-
First Trust Global Funds PLC UK Regulatory Announcement: Net Asset Value(s)
LONDON--(BUSINESS WIRE)-- Funds Date TIDM ISIN Code Shares in Issue Currency Net Asset Value NAV/per Share First Trust Nasdaq Clean Edge Smart Grid Infrastructure UCITS ETF 09.07.2026 GRDU.LN IE000J80JTL1 41,550,002.00 USD 2,649,006,897.10 63.755 ...
-
JIHYO of Global K-Pop Phenomenon TWICE and GRAMMY®-Nominated Dancehall Star Shenseea Release New Single "Distant Lover" and Official Music Video Today
LOS ANGELES--(BUSINESS WIRE)--Today, JIHYO of the record-breaking global K-pop group TWICE and GRAMMY®-nominated Jamaican artist Shenseea officially release their highly anticipated new collaboration, "Distant Lover," available now on all major streaming platforms alongside its vibrant official music video. Listen to "Distant Lover" HERE Watch the Official Music Video HERE Bringing together K-pop, dancehall, and Afrobeats influences, "Distant Lover" delivers an infectious summer anthem that sho...

-
Ategrity Specialty Insurance Pre-Announces Record Second Quarter 2026 Results; Appoints Neil Adler Chief Financial Officer
NEW YORK--(BUSINESS WIRE)--Ategrity Specialty Insurance Company Holdings (NYSE: ASIC) today announced preliminary financial results for the second quarter ended June 30, 2026, which exceeded the Company's previously communicated outlook and current analyst consensus expectations. For the second quarter ended June 30, 2026, Ategrity expects to report: Record gross written premiums of more than $205 million, representing growth exceeding 22% year-over-year and accelerated market share gains relat...
-
Qtis.ai Launches AI-Native Clinical Research Division, Enters Fast-Growing $7.4 Billion CTMS Market
CUPERTINO, Calif.--(BUSINESS WIRE)--Qtis.ai enters the $7.4B clinical research software market with first commercial deployment of its AI-native CTMS, EDC and DMS....
-
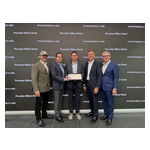
AutoNation and Porsche Cars North America Celebrate Opening of Porsche Hilton Head
HARDEEVILLE, S.C.--(BUSINESS WIRE)--AutoNation, Inc. (NYSE:AN), one of the largest automotive retailers in the United States, announced the opening of Porsche Hilton Head, a newly constructed retail and service center designed to deliver the full Porsche luxury experience to customers and enthusiasts across Hilton Head Island, the greater Savannah area, and the wider Lowcountry. Located at 84 Auto Mall Boulevard in Hardeeville, the two-floor, 34,000-square-foot facility is one of a select numbe...
-
Special Project Delivery Names Mark Wood Special Advisor, Government & Defense Contract Management
NEWPORT BEACH, Calif.--(BUSINESS WIRE)--Special Project Delivery Names Mark Wood Special Advisor, Government & Defense Contract Management...
-
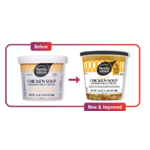
Blount’s Family Kitchen Unveils Refreshed Packaging Highlighting Premium Ingredients, Protein and Refrigerated Freshness
WARREN, R.I.--(BUSINESS WIRE)--Blount Fine Foods, a fifth-generation family-owned maker of premium refrigerated soups, today announced refreshed packaging for its Blount’s Family Kitchen line, created to help shoppers recognize the brand’s fresh ingredients and protein-forward recipes at shelf. The updated design reflects how today’s soup shoppers navigate the refrigerated deli section: quickly, visually and with interest in meals that deliver comfort, quality ingredients and nutrition. Blount’...