

Newsroom
Sorted by: Latest
-
爱康门诊成功部署InterSystems TrakCare,助力实现健康管理愿景
中国北京--(BUSINESS WIRE)--(美国商业资讯)-- 为全球超过 10 亿份健康记录提供支持的创新数据技术提供商 InterSystems 今日宣布,InterSystems TrakCare® 统一的医疗信息系统已在爱康集团旗下高端医疗服务品牌爱康门诊上线部署。 TrakCare 的部署建立了一套统一的医疗信息系统解决方案,解决了数据重复和数据孤岛等问题,为爱康集团实现其健康管理愿景奠定了坚实基础。爱康集团是中国领先的以人工智能驱动的、基于医疗大数据云端服务的数字化健康管理平台。通过旗下多个品牌,为团体客户和家庭、个人提供高品质的健康体检、疾病检测、齿科服务、私人医生、职场医疗、疫苗接种、抗衰老、康复医疗等健康管理与医疗服务。 单一事实数据源服务于爱康集团诊所业务 TrakCare拥有无缝共享单一用户界面、单一代码库和单一高性能数据平台(存储和共享所有患者记录)的一整套产品。数据仅需录入一次即可在整个系统中即刻可用。此外,在标准核心功能的基础上,支持以模块化的方式进行部署,可满足不同诊所多元化的需求。 在此次合作中,TrakCare为爱康全国门诊建立了单一事实数据源,以...
-
iKang Outpatient Deploys InterSystems TrakCare to Realize Health Management Vision
BEIJING--(BUSINESS WIRE)--InterSystems, a creative data technology provider powering more than one billion health records globally, today announced the successful deployment of InterSystems TrakCare® across iKang Outpatient, the premium healthcare services brand of iKang Healthcare Group. The TrakCare deployment establishes a unified electronic health record (EHR) solution, resolving issues such as data duplication and data silos, and lays the foundation for iKang Healthcare Group to realize it...
-
Sangfor Technologies Included in the 2026 Gartner® Magic Quadrant™ for SASE Platforms
HONG KONG--(BUSINESS WIRE)--Sangfor’s inclusion in the 2026 Gartner® Magic Quadrant™ for SASE Platforms highlights Athena SASE as a strong global SASE alternative from Asia....
-
H2O.ai and CAN.B Group Partner to Advance Sovereign AI in Australia
CANBERRA, Australia--(BUSINESS WIRE)--H2O.ai, the sovereign enterprise AI platform for predictive, generative and agentic AI, with built-in observability and governance, today announced a strategic partnership with CAN.B Group, an Australian-owned technology and advisory company, to help government agencies, critical infrastructure operators and highly regulated organisations design, deploy and govern AI within Australian sovereign, regulatory and mission requirements. The partnership combines...
-
First Plus Expands Relationship with SS&C to Support Cross-Border Operations in APAC
WINDSOR, Conn.--(BUSINESS WIRE)--First Plus Expands Relationship with SS&C to Support Cross-Border Operations in APAC...
-
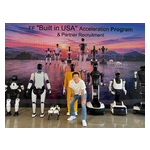
Faraday Future Global CEO YT Jia Shares Weekly Investor Update: Sets Another Monthly Robotics Sales Record, Launches the EAI Robotics “Built in USA” Acceleration Program, Previews the FF “Built in USA” Industry Chain Partner Recruitment Conference
LOS ANGELES--(BUSINESS WIRE)--Faraday Future Intelligent Electric Inc. (NASDAQ: FFAI) (“Faraday Future”, “FF” or the “Company”), a California-based global Embodied AI (EAI) ecosystem company, today shared a weekly business update from YT Jia, Founder and Global CEO of FF. “Hello from Weekly Report Issue 66. This week, I’d like to share our July sales campaign report, introduce FF EAI Robotics’ “Built in USA” Acceleration Program against the backdrop of the FCC’s new policies supporting the robo...
-
Lone Star Funds Acquires Multi-Family Residential Portfolio in Central Tokyo
DALLAS & NEW YORK & LONDON & TOKYO--(BUSINESS WIRE)--Lone Star Funds (“Lone Star”) today announced that an affiliate of Lone Star Real Estate Fund VII, L.P has successfully completed the acquisition of a multi-family residential portfolio (a total of 1,166 units) in central Tokyo. Located in the Shinkawa and Tsukuda submarkets of Chuo Ward in Central Tokyo, the portfolio consists of a 35-story, 505-unit residential tower and a separate campus of five buildings, four residential and one retail,...
-
CASH Investors Have Opportunity to Join Pathward Financial, Inc. Fraud Investigation with SBS Law
LOS ANGELES--(BUSINESS WIRE)--CASH Investors Have Opportunity to Join Pathward Financial, Inc. Fraud Investigation with SBS Law...
-
COLD Investors Have Opportunity to Join Americold Realty Trust, Inc. Fraud Investigation with SBS Law
LOS ANGELES--(BUSINESS WIRE)--COLD Investors Have Opportunity to Join Americold Realty Trust, Inc. Fraud Investigation with SBS Law...
-
CELC Investors Have Opportunity to Join Celcuity Inc. Fraud Investigation with SBS Law
LOS ANGELES--(BUSINESS WIRE)--CELC Investors Have Opportunity to Join Celcuity Inc. Fraud Investigation with SBS Law...