Newsroom
Sorted by: Latest
-
Samenvatting: Vasion Output™ van Vasion behaalt SAP®-gecertificeerde integratie met GROW voor SAP en met RISE met S/4HANA® Cloud
ST. GEORGE, Utah--(BUSINESS WIRE)--Vasion, een leider op het gebied van serverloos printen en Intelligent Print Automation, maakte vandaag bekend dat Vasion Output de SAP®-certificering heeft behaald voor integratie met GROW met SAP en integratie met RISE met SAP S/4HANA® Cloud. De Vasion-oplossing is speciaal ontwikkeld om verouderd uitvoerbeheer te elimineren wanneer deze cloudmigratie in de weg staan De certificering bevestigt wat klanten van enterprise resource planning (ERP) die overstappe...

-
HekaBio and Alpha Tau Medical Obtain Approval in Japan for Solid Tumor Treatment Alpha DaRT
TOKYO--(BUSINESS WIRE)--Japan approves Alpha DaRT for head & neck cancer, becoming the first market outside Israel....
-
AdvanCell präsentiert auf dem ASCO GU Symposium 2026 das neuartige Phase-2-Studiendesign von ADVC001 zur Behandlung von metastasiertem Prostatakrebs
BRISBANE, Australien & BOSTON--(BUSINESS WIRE)--AdvanCell, ein Radiopharmaunternehmen in der klinischen Entwicklungsphase, das innovative zielgerichtete Alpha-Therapien gegen Krebs entwickelt, gab heute das neuartige Phase-2-Design der laufenden klinischen TheraPb-Studie zu ADVC001 bei metastasiertem Prostatakrebs bekannt. ADVC001 ist eine in klinischer Prüfung befindliche, Blei-212-basierte, auf das prostataspezifische Membranantigen (PSMA) gerichtete Alpha-Therapie. Das Studiendesign wird die...

-
Riassunto: Vasion Output™ di Vasion ottiene l'integrazione certificata SAP® con GROW per SAP e con RISE con S/4HANA® Cloud
ST. GEORGE, Utah--(BUSINESS WIRE)--Vasion, un leader nella stampa senza server e nella Intelligent Print Automation (automazione intelligente della stampa), oggi ha annunciato che Vasion Output ha ottenuto la certificazione SAP® come integrata con GROW con SAP e integrata con RISE con SAP S/4HANA® Cloud. La soluzione Vasion è realizzata appositamente per eliminare la tradizionale gestione dell'output come ostacolo alla migrazione al cloud. La certificazione conferma l'esigenza più urgente dei c...

-
ExaGrid es reconocida con un nuevo premio de la industria
MARLBOROUGH, Mass.--(BUSINESS WIRE)--ExaGrid®, líder en almacenamiento de copias de seguridad por niveles (Tiered Backup Storage), anunció hoy que recibió un premio en la categoría Almacenamiento Secundario en la primera edición anual de los StorageNewsletter Awards. Un jurado integrado por siete especialistas seleccionó a los ganadores de los StorageNewsletter Awards en cada categoría. “Como innovador con una extensa trayectoria, ExaGrid ha desempeñado un papel clave en la nueva era del almace...

-
ExaGrid remporte un nouveau prix industriel
MARLBOROUGH, Massachusetts--(BUSINESS WIRE)--ExaGrid®, le leader du stockage de sauvegarde à plusieurs niveaux, a annoncé aujourd’hui avoir reçu un prix dans la catégorie « Stockage secondaire » lors de la première édition annuelle des StorageNewsletter Awards. Les lauréats des StorageNewsletter Awards ont été choisis par un jury de sept membres qui a sélectionné les fournisseurs pour chaque catégorie. « En tant qu’innovateur de longue date, ExaGrid a joué un rôle clé dans l’avènement d’une nou...

-
エクサグリッド、業界アワードを受賞
米マサチューセッツ州マールボロ--(BUSINESS WIRE)--(ビジネスワイヤ) -- ExaGrid®(エクサグリッド)は階層型バックアップストレージ分野をリードすることで有名ですが、同社は本日、初開催となるStorageNewsletter Awardsにおいて、セカンダリ・ストレージ部門の賞を受賞したと発表しました。 StorageNewsletter Awardsの受賞企業は、7名で構成される審査員が各部門のベンダーを選定して決定しました。「エクサグリッドは長年にわたり革新を続け、スケールアウト・アーキテクチャでセカンダリ・ストレージの新しい流れをつくってきました。プラットフォームは当初HDD中心で設計されましたが、現在はSSDにも対応しています。強力なチャネル網に加え、多くのバックアップソフトウェアベンダーからの広い支持を背景に、市場シェアを速いペースで伸ばし続けています。機能を磨き込みながらこの分野を長年牽引してきた同社の今後は、成長見通しも非常に有望です。」とのコメントをStorageNewsletterのオーナー兼編集長で、StorageNewsletter A...

-
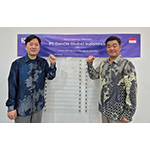
Genon Opens First Overseas Office in Jakarta to Lead AI Transformation in Asia
JAKARTA, Indonesia--(BUSINESS WIRE)--Genon, a South Korean AI solution provider, established its first international subsidiary in Jakarta to lead AI transformation across Asia...
-
INVESTOR ALERT: Securities Class Action Filed Against Navan, Inc. – Investors Encouraged to Contact Kirby McInerney LLP
NEW YORK--(BUSINESS WIRE)--The law firm of Kirby McInerney LLP announces that a class action lawsuit has been filed on behalf of investors who acquired Navan, Inc. (“Navan” or the “Company”) (NASDAQ:NAVN) securities pursuant to the registration statement and prospectus (collectively “offering documents”) issued in connection with the Company’s October 2025 initial public offering (“IPO”). If you suffered a loss on your Navan investments, you have until April 24, 2026 to request lead plaintiff a...
-
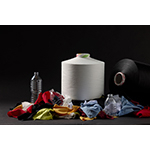
REPREVE®的制造商UNIFI®公司,公布了《可持续发展报告》的新目标
北卡罗来纳州 格林斯伯勒--(BUSINESS WIRE)--(美国商业资讯)-- UNIFI公司(纽约证券交易所代码:UFI),作为REPREVE®的制造商以及世界领先的再生和合成纤维创新者之一,今日公布了其2025财年的可持续发展报告。报告中重点介绍了UNIFI®在REPREVE平台增长方面取得的进展,及其对循环材料的承诺。 公司在报告中迎来了一项重大里程碑事件:通过REPREVE平台(包括REPREVE Takeback™、ThermaLoop™ 填充、REPREVE ReCirculate™和REPREVE Nylon)已累计转化了10亿件T恤当量的纺织品和纱线废料。继本财年初UNIFI在全球推出由纺织品和纱线废料制成的填充棉及白色长丝后,这一增长势头仍在持续。 UNIFI在报告中公布了一项新目标:到2030财年回收再利用650亿个塑料瓶。该目标与此前制定的2030财年目标相吻合,包括回收利用15亿件T恤当量的纺织品和纱线废料。报告表明,UNIFI通过持续扩展REPREVE平台并践行负责任的生产制造,逐年降低了对温室气体排放、能源、水资源及原材料消耗的影响。 UNIFI首席执行...