

Newsroom
Sorted by: Latest
-
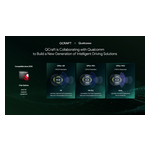
QCraft在Qualcomm最新Snapdragon Ride SoC上展示城市NOA,目標於2026年實現全球量產
中國無錫--(BUSINESS WIRE)--(美國商業資訊)-- 在2026年Qualcomm汽車技術與合作峰會上,QCraft與Qualcomm讓與會者有機會在配備SA8650P的量產車型中,親身體驗QCraft的城市NOA解決方案,這標誌著向2026年全球量產邁出了關鍵一步。 該峰會於6月5日舉行,是自QCraft與Qualcomm於2025年9 月建立戰略合作夥伴關係以來的最新里程碑。在不到一年的時間裡,QCraft已在Qualcomm的SA8775P和SA8650P平台上完成了高速公路與城市NOA的開發及道路驗證,並計劃於2026年進行全球交付。目前,雙方正共同開發基於Qualcomm QAM8797P平台、具備更高算力的解決方案。 在峰會期間的城市實地測試搭乘中,搭載SA8650P的車輛處理了無保護左轉、人車混流路況、隧道、主副道切換以及擁堵路段的操控,展現出平穩且如同人類駕駛般的控制能力。QCraft技術長Dong Li博士發表了主題為「從自動駕駛到通用型物理人工智慧」的演講,他表示:「QCraft在Snapdragon Ride™平台上的開發已進入量產的快車道。」 大規...
-
SynergenX, Low T Center and HerKare Clinics Unite Under the SynergenX Brand
HOUSTON--(BUSINESS WIRE)--SynergenX announced today that its Low T Center and HerKare clinics will begin transitioning under one unified brand identity over the coming year, reflecting the organization’s continued commitment to helping patients live healthier, more confident, and more fulfilling lives. Though the company will be unveiling an exciting new logo and updated marketing materials, this transition represents more than a visual evolution. It reflects a broader philosophy of care center...
-
Sable Offshore Corp. to Host Conference Call on June 12, 2026
HOUSTON--(BUSINESS WIRE)--Sable Offshore Corp. to Host Conference Call on June 12, 2026...
-
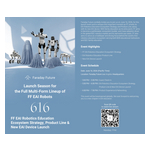
Faraday Future Announces the Launch of Its EAI Robotics Education Ecosystem Strategy, Product Line & New EAI Device Launch being held on June 16, 2026
LOS ANGELES--(BUSINESS WIRE)--Faraday Future Intelligent Electric Inc. (NASDAQ: FFAI) (“Faraday Future”, “FF” or the “Company”), a California-based global Embodied AI (EAI) ecosystem company, today announced additional details for its FF EAI Robotics Education Ecosystem Strategy, Product Line & New EAI Device Launch being held on June 16, 2026, at the Company’s Los Angeles headquarters. FF is inviting those interested in this momentous occasion to join the Company in person or online for th...
-
AM Best Affirms Issue Credit Rating of Weston2044 LLC Series Hannover, No. 1 Variable Funding Credit Linked Note
OLDWICK, N.J.--(BUSINESS WIRE)--AM Best has affirmed the Long-Term Issue Credit Rating (Long-Term IR) of “a” (Excellent) on the $1.654 billion (which upsized to $1.805 billion outstanding as of March 31, 2026), 6.00% Series Hannover, No. 1 variable funding credit-linked note (note), due Oct. 1, 2044, of Weston2044 LLC (Weston2044), a Delaware limited liability company (issuer). The outlook of this Credit Rating (rating) is stable. The note is in consideration of a variable funding surplus note...
-
Pleo annonce de nouvelles fonctionnalités d'Agentic, qui révolutionnent la gestion financière et la prise de décision
LONDRES--(BUSINESS WIRE)--Pleo, la plateforme européenne de référence en matière de finance stratégique, annonce aujourd'hui le lancement d'une suite d'agents IA capables de gérer de manière autonome les dépenses courantes, permettant ainsi aux responsables financiers de se concentrer sur la prise de décision plutôt que sur les tâches administratives. Les équipes financières subissent une pression croissante : 45 % des entreprises européennes affirment que leurs processus actuels les ralentisse...
-
Travere Therapeutics Reports Inducement Grants Under Nasdaq Listing Rule 5635(c)(4)
SAN DIEGO--(BUSINESS WIRE)--Travere Therapeutics, Inc. (Nasdaq: TVTX) today announced that on June 10, 2026, the Compensation Committee of its Board of Directors granted inducement equity grants to six new employees, consisting of inducement restricted stock units, or RSUs, covering an aggregate of 32,000 shares of its common stock. These inducement RSUs are subject to the terms of Travere’s 2018 Equity Incentive Plan (“2018 Plan”) but were granted outside of the 2018 Plan and were granted as i...
-
Venture Global Announces Closing of $2.25 Billion of Senior Secured Notes
ARLINGTON, Va.--(BUSINESS WIRE)--Venture Global Announces Closing of $2.25 Billion of Senior Secured Notes...
-
REMEDY Raises Series A Led by L Catterton to Modernize Dermatologist-Developed Skincare
LOS ANGELES--(BUSINESS WIRE)--Remedy Science (“REMEDY”), the dermatologist-developed, education-first skincare brand translating clinical expertise into accessible, high-performance products, today announced the closing of its Series A funding round led by L Catterton, the largest global consumer-focused investment firm, with participation from existing investor Norwest and new investor Sonoma Brands Capital. Founded by board-certified dermatologist Dr. Muneeb Shah, REMEDY was created to mirror...
-
Samenvatting: Pleo kondigt nieuwe agentic capaciteiten aan, die het aspect van financieel management en beslissingname veranderen
LONDEN--(BUSINESS WIRE)--Pleo, Europa's eerste en meest vertrouwde platform voor strategische finance, kondigde vandaag een reeks AI agents aan die routine uitgavenbeheer autonoom afhandelen, zodat finance leiders hun aandacht kunnen toespitsen op beslissingen in plaats van hun tijd aan administratieve taken te besteden. Finance teams staan steeds meer onder druk: 45% van de Europese bedrijven geeft aan dat hun huidige processen hen afremmen, en leiders beschrijven goedkeuringsworkflows als zo...