Newsroom
Sorted by: Latest
-
ŌURA Signs England Football Legends Harry Kane and Declan Rice as Global Brand Ambassadors
SAN FRANCISCO--(BUSINESS WIRE)--ŌURA, maker of the world’s leading smart ring, today announced long-term partnerships with both Harry Kane and Declan Rice, two of the world’s most celebrated footballers, to champion how top athletes are focusing on understanding a full picture of their health to get the competitive edge. As they navigate one of the most intense and exciting periods in the football calendar, both players are turning to Oura Ring 5 for its discreet, accurate health sensing to hel...
-
First Trust Global Funds PLC UK Regulatory Announcement: Net Asset Value(s)
LONDON--(BUSINESS WIRE)-- Funds Date TIDM ISIN Code Shares in Issue Currency Net Asset Value NAV/per Share First Trust Vest U.S. Equity Max Buffer UCITS ETF- June 10.06.2026 MJUN LN IE000CO3P697 150,002.00 USD 3,797,887.24 25.319 ...
-
Backpack Now a Nacha Preferred Partner for ACH Experience, Open Banking, and Risk and Fraud Prevention
RESTON, Va.--(BUSINESS WIRE)--Nacha announced that Backpack has become a Nacha Preferred Partner for ACH Experience, Open Banking, and Risk and Fraud Prevention. Backpack’s financial infrastructure is built specifically for higher education, helping universities, families, and education funding organizations manage 529, scholarship, and other third-party payments. Backpack helps institutions eliminate paper checks through ACH-native workflows and automation, reducing administrative burden and i...
-
First Trust Global Funds PLC UK Regulatory Announcement: Net Asset Value(s)
LONDON--(BUSINESS WIRE)-- Funds Date TIDM ISIN Code Shares in Issue Currency Net Asset Value NAV/per Share First Trust Vest Nasdaq-100 Moderate Buffer UCITS ETF - December 10.06.2026 QDEC.LN IE000GAKWFA7 450,002.00 USD 10,759,192.98 23.909 ...
-
GLOB Investors Have Opportunity to Lead Globant S.A. Securities Fraud Lawsuit with the Schall Law Firm
LOS ANGELES--(BUSINESS WIRE)--GLOB Investors Have Opportunity to Lead Globant S.A. Securities Fraud Lawsuit with the Schall Law Firm...
-
KBRA Credit Profile Releases CREFC June Conference 2026: Day 3 Recap
NEW YORK--(BUSINESS WIRE)--KBRA Credit Profile (KCP), a division of KBRA Analytics, releases its Day 3 recap of the CRE Finance Council (CREFC) June Conference 2026. Key Takeaways Private credit continues to expand within commercial real estate (CRE) lending, supported by growing insurance company participation and increasing demand for flexible financing solutions. Single-asset single borrower (SASB) and CRE collateralized loan obligations (CLO) dominate commercial mortgage-backed securities (...
-
Recovery Point Systems Featured as a Market Challenger in the Newly Released ISG Provider Lens™ 2026 Mainframes – Services and Solutions Report
GERMANTOWN, Md.--(BUSINESS WIRE)--Recovery Point Systems (RPS), a leading provider of cyber resiliency and business continuity solutions, today announced that the full ISG Provider Lens™ 2026 Mainframes – Services and Solutions report is now available, detailing the company's recognition as a Market Challenger in the Mainframe as a Service (MFaaS) quadrant for both the U.S. and U.S. Public Sector regions. The ISG Provider Lens report evaluates leading providers of mainframe services and solutio...
-
Angel Guild Grows Toward 2.4 Million Members as Company Launches New Innovations on the Angel Platform and App to Strengthen Community
PROVO, Utah--(BUSINESS WIRE)--Angel (NYSE: ANGX) – a media and technology company successfully pioneering a first-of-its-kind audience-driven studio model in which Angel Guild members watch, screen and vote on which films and television series get distributed in theaters and on the Angel platform – announced that the company has added nearly 200,000 Guild members since Q1, boosting the Guild to now nearly 2.4 million paying members. The company also announced today that it is launching new tech...
-
Sand Grove Capital Management LLP UK Regulatory Announcement: Form 8.3
LONDON--(BUSINESS WIRE)-- FORM 8.3 PUBLIC OPENING POSITION DISCLOSURE/DEALING DISCLOSURE BY A PERSON WITH INTERESTS IN RELEVANT SECURITIES REPRESENTING 1% OR MORE Rule 8.3 of the Takeover Code (the “Code”) 1. KEY INFORMATION (a) Full name of discloser: Sand Grove Capital Management LLP (b) Owner or controller of interests and short positions disclosed, if different from 1(a): The naming of nominee or vehicle companies is insufficient. For a trust, the trustee(s), settlor and beneficiaries mu...
-
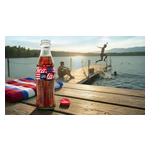
Arca Continental Coca-Cola Southwest Beverages Celebrates America’s 250th Birthday with Commemorative Cans
DALLAS--(BUSINESS WIRE)--Limited-edition America250 Coca-Cola cans and bottles are now available courtesy of Arca Continental Coca-Cola Southwest Beverages (AC-CCSWB)....