

Newsroom
Sorted by: Latest
-
NUBURU Announces Closing of $38.0 Million Public Offering
DENVER--(BUSINESS WIRE)--NUBURU, Inc. (NYSE American: BURU), a next-generation dual-use Defense & Security integrated platform company, today announced the closing of its previously announced best-efforts public offering, generating gross proceeds of approximately $38.0 million, before deducting placement agent fees and other offering expenses. The offering consisted of an aggregate of 244,372,984 shares of common stock and/or pre-funded warrants to purchase shares of common stock, together...
-
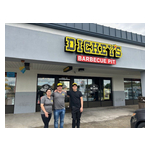
Husband-and-Wife Team Open Camp Hill Dickey's, Plan Upgrades and Community Celebration
HARRISBURG, Pa.--(BUSINESS WIRE)--A new husband-and-wife ownership team has stepped behind the smoker at Dickey's Barbecue Pit in Camp Hill and is already planning investments designed to enhance the guest experience while continuing the restaurant's tradition of serving authentic, slow-smoked Texas barbecue.Marten and Nermin Abdou officially started their franchise journey with the Dickey's Barbecue Pit located in Camp Hill on June 22 and are excited to serve the community they have called home...
-
Les données d'Incyte seront présentées durant quatre présentations orales rapides au Congrès 2026 de la Société européenne d'oncologie médicale (ESMO) pour soutenir les efforts visant à améliorer les résultats dans les cancers difficiles à traiter
WILMINGTON, Delaware--(BUSINESS WIRE)--Incyte (Nasdaq : INCY) annonce aujourd'hui la présentation de données de plusieurs programmes de son portefeuille d'oncologie lors de six présentations au Congrès 2026 de la Société européenne d'oncologie médicale (ESMO), qui se tiendra du 23 au 27 octobre 2026 à Madrid. « Les données présentées à l’ESMO illustreront l’engagement d’Incyte à faire progresser l’innovation pour les patients atteints de cancer », déclare Pablo J. Cagnoni, M.D., président d’Inc...
-
Samenvatting: Gegevens van Incyte zullen centraal staan in vier korte mondelinge presentaties tijdens het congres van de European Society for Medical Oncology (ESMO) in 2026, waarin de inspanningen om de behandelresultaten bij moeilijk te behandelen ...
WILMINGTON, Del.--(BUSINESS WIRE)-- Gegevens van Incyte zullen centraal staan in vier korte mondelinge presentaties tijdens het congres van de European Society for Medical Oncology (ESMO) in 2026, waarin de inspanningen om de behandelresultaten bij moeilijk te behandelen kankers te verbeteren worden besproken Incyte (Nasdaq:INCY) heeft vandaag bekendgemaakt dat het tijdens het congres van de European Society of Medical Oncology (ESMO) 2026 in zes presentaties gegevens uit verschillende program...
-
Securities Fraud Investigation Into Pentair plc (PNR) Continues – Shareholders Who Lost Money Urged To Contact Glancy Prongay Wolke & Rotter LLP, a Leading Securities Fraud Law Firm
LOS ANGELES--(BUSINESS WIRE)--Glancy Prongay Wolke & Rotter LLP, a leading national shareholder rights law firm, continues its investigation on behalf of Pentair plc (“Pentair” or the “Company”) (NYSE: PNR) investors concerning the Company’s possible violations of the federal securities laws. IF YOU ARE AN INVESTOR WHO LOST MONEY ON PENTAIR PLC (PNR), CLICK HERE TO INQUIRE ABOUT POTENTIALLY PURSUING CLAIMS TO RECOVER YOUR LOSS. What Happened? On July 15, 2026, Pentair released certain secon...
-
Goldgroup Mining and Gold Resource Corporation Announce Closing of Business Combination and Goldgroup’s Anticipated Listing on the NYSE American
VANCOUVER, British Columbia & DENVER--(BUSINESS WIRE)--Goldgroup Mining Inc. (TSX-V: GGA; OTC: GGAZD) (“Goldgroup” or the “Company”) and Gold Resource Corporation (NYSE American: GORO) (“GRC”) are pleased to announce that they have closed the previously announced merger (the “Merger”) pursuant to the Arrangement Agreement and Plan of Merger, dated January 25, 2026 and amended on May 15, 2026, by and among GRC, Goldgroup, and Goldgroup Merger Sub Inc., a wholly owned subsidiary of Goldgroup (“Me...
-
Sportradar Deadline Today: Rosen Law Firm Urges Sportradar Group AG (NASDAQ: SRAD) Stockholders with Large Losses to Contact the Firm for Information About Their Rights
NEW YORK--(BUSINESS WIRE)--Rosen Law Firm, a global investor rights law firm, announces a class action lawsuit on behalf of purchasers and acquirers of Sportradar Group AG (NASDAQ: SRAD) Class A ordinary shares between November 7, 2024 and April 21, 2026 (the “Class Period”). Sportradar provides data platforms and services to the global sports betting industry.For more information, submit a form, email attorney Phillip Kim, or give us a call at 866-767-3653.The Allegations: Rosen Law Firm is Inv...
-
Octagon Responds to Increasingly Desperate Claims by XFLT’s Board
NEW YORK--(BUSINESS WIRE)--Octagon Credit Investors, LLC (“Octagon” or “our”), a leading credit-focused asset manager with 30 years of experience, today responded to the ongoing false claims made by XAI Floating Rate & Alternative Income Trust (NYSE: XFLT) (formerly, XAI Octagon Floating Rate & Alternative Income Trust) (the “Fund” or “XFLT”) in connection with XFLT’s upcoming special meeting of shareholders, which is scheduled to be held on July 30, 2026 (the “Special Meeting”). “It is...
-
Securities Fraud Investigation Into Pentair plc (PNR) Continues – Shareholders Who Lost Money Urged to Contact The Law Offices of Frank R. Cruz
LOS ANGELES--(BUSINESS WIRE)--The Law Offices of Frank R. Cruz continues its investigation of Pentair plc (“Pentair” or the “Company”) (NYSE: PNR) on behalf of investors concerning the Company’s possible violations of federal securities laws.IF YOU ARE AN INVESTOR WHO LOST MONEY ON PENTAIR PLC (PNR), CLICK HERE TO INQUIRE ABOUT POTENTIALLY PURSUING A CLAIM TO RECOVER YOUR LOSS.What Is The Investigation About?On July 15, 2026, Pentair released certain second quarter 2026 financial results, disclo...
-
Reputation Resolutions Launches New Website and Expands Services for the AI Era of Online Reputation Management
DENVER--(BUSINESS WIRE)--Reputation Resolutions, a leading online reputation management firm, today announced the launch of its new website and an expanded lineup of services designed for the changing search landscape. The launch marks a new chapter for the firm, pairing the results-based reputation services clients have long relied on with expanded capabilities for a world where artificial intelligence increasingly shapes how people and companies are perceived online. “This is Reputation Resol...