

Newsroom
Sorted by: Latest
-
Samenvatting: Hanshow en de Universiteit van Cambridge lanceren een gezamenlijk onderzoek naar augmented intelligente hybride draadloze technologie
LONDEN--(BUSINESS WIRE)--Hanshow, een wereldleider in ESL (electronic shelf labels) en digitale winkeloplossingen, is een meerjarige onderzoekssamenwerking aangegaan met de Universiteit van Cambridge, een van de meest prestigieuze academische instellingen ter wereld. Het partnerschap zal zich toeleggen op gezamenlijk onderzoek en innovatie in intelligente hybride draadloze technologieën van de nieuwe generatie. Dit markeert een belangrijke mijlpaal in Hanshows voortdurende investering in kernte...
-
World Liberty Financial’s Stablecoin $USD1 Crosses $3 Billion in Market Capitalization
NEW YORK--(BUSINESS WIRE)--World Liberty Financial (“WLFI”) announced that its flagship digital dollar stablecoin USD1 has, for the first time, eclipsed $3 billion in circulating supply. According to Coinmarketcap.com, USD1 today reached a peak supply of over $3.07 billion. “We launched USD1 because traditional institutions needed a crypto-native but trusted instrument to reap the power of DeFi, but we’ve seen extraordinary demand across the board,” said Zach Witkoff, Co-founder and CEO of Worl...

-
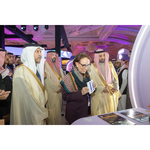
Social Development Bank benadrukt strategische partnerschappen en wereldwijde initiatieven op DeveGo 2025
RIYAD, Saoedi-Arabië--(BUSINESS WIRE)--De Social Development Bank (SDB) organiseerde de tweede editie van het Forum voor Ondernemerschap en Moderne Bedrijfspraktijken, 'DeveGo 2025', van 21 tot 23 december in Riyad. Gehouden onder auspiciën van Zijne Excellentie. Ahmed bin Sulaiman Al Rajhi, minister van Human Resources en Sociale Ontwikkeling en voorzitter van de Raad van Bestuur van SDB, brengt het forum regeringsleiders, wereldwijde experts, investeerders en ondernemers samen om de toekomst...

-
La Social Development Bank evidenzia le partnership strategiche e le iniziative globali al DeveGo 2025
RIAD, Arabia Saudita--(BUSINESS WIRE)--Dal 21 al 23 dicembre, la Social Development Bank (SDB) ha ospitato a Riad la seconda edizione del Forum sull'imprenditorialità e le moderne pratiche commerciali, "DeveGo 2025". Organizzato sotto il patrocinio di Sua Eccellenza l'Ing. Ahmed bin Sulaiman Al Rajhi, Ministro delle Risorse Umane e dello Sviluppo Sociale e Presidente del Consiglio di Amministrazione della SDB, il forum riunisce leader governativi, esperti globali, investitori e imprenditori per...
-
DeveGo 2025 : la Banque de Développement Social (SDB) souligne l’importance des partenariats stratégiques et des initiatives internationales
RIYAD, Arabie Saoudite--(BUSINESS WIRE)--La Banque de Développement Social (Social Development Bank - SDB) a organisé la deuxième édition du Forum de l’Entrepreneuriat et des Pratiques Commerciales Modernes « DeveGo 2025 », du 21 au 23 décembre à Riyad. Placé sous le patronage de Son Excellence l’ingénieur Ahmed bin Sulaiman Al Rajhi, ministre des Ressources Humaines et du Développement Social, président du conseil d’administration de la SDB, l’événement a réuni des responsables gouvernementaux...

-
Asia Pacific Mining Industry Review 2025: Production by Country, Major Operating Mines, Major Exploration, and Development Projects - ResearchAndMarkets.com
DUBLIN--(BUSINESS WIRE)--The "Asia Pacific Mining Review 2025" report has been added to ResearchAndMarkets.com's offering. The report contains an overview of the Asia Pacific mining industry including key macroeconomic trends, commodity price, and operating environment across major and emerging mining markets. It provides detailed information on production by country, major operating mines, major exploration, and development projects. Asia Pacific is one of the world's leading mining regions, e...
-
Nintendo Download: Happy Holidays!
REDMOND, Wash.--(BUSINESS WIRE)--This week’s Nintendo Download includes the following content: Digital Spotlight: ’Tis the Season – If you’re looking to spend some quality time with friends and family, why not spread the cheer with some games on the Nintendo Switch 2 and Nintendo Switch systems? Stir up some friendly competition with Super Mario Party Jamboree – Nintendo Switch 2 Edition + Jamboree TV, where the party doesn’t have to stop after the gifts are unwrapped! Or, find out who’s the to...
-
Hanshow and the University of Cambridge Launch Joint Research on Augmented Intelligent Hybrid Wireless Technology
LONDON--(BUSINESS WIRE)--Hanshow, a global leader in electronic shelf labels (ESL) and digital store solutions, has entered into a multi-year research collaboration with the University of Cambridge, one of the world’s most prestigious academic institutions. The partnership will focus on joint research and innovation in next-generation intelligent hybrid wireless technologies, marking an important milestone in Hanshow’s continued investment in core technologies and long-term innovation. This col...
-
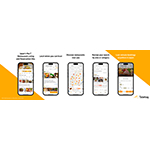
Samenvatting: Tabelog, Japans grootste (*1) service voor het zoeken en boeken van een restaurant, lanceert een meertalige app voor internationale bezoekers
TOKIO--(BUSINESS WIRE)--Op maandag 17 november 2025 lanceerde Tabelog (https://tabelog.com/en/), Japans grootste service om een restaurant te zoeken en te boeken, geëxploiteerd door Kakaku.com, Inc., haar meertalige smartphone-app (iOS/Android) voor internationale reizigers. Met circa 100 miljoen gebruikers per maand (*3) is Tabelog Japans topservice die alom door Japanse locals wordt gebruikt om dagelijks een goed restaurant te vinden. De database is ongeëvenaard binnenlands en bevat informati...
-
日本最大的 (*1) 餐廳搜尋和訂位網站Tabelog推出多國語言應用程式,專為國際觀光客打造
東京--(BUSINESS WIRE)--(美國商業資訊)--由Kakaku.com, Inc.經營的 Tabelog (https://tabelog.com/en/) 是日本最大的餐廳搜尋和訂位網站。該網站於2025年11月17日(星期一)為國際觀光客推出多國語言智慧型手機應用程式(適用iOS/Android手機)。 Tabelog的每月使用人數約 1 億人 (*3),是日本首屈一指的餐廳搜尋服務,廣受日本當地民眾愛用。其資料庫的規模在日本境內無人能比,收納全國各地約89萬家餐飲場所的資料以及8500萬多則留言與照片 (*4)。Tabelog有別於全球地圖服務或旅遊網站,它建立在「日本當地使用者的真實評等與留言」之上,協助觀光客找出日本民眾心目中最道地的好餐廳,而不是觀光取向的餐飲場所。 Tabelog先前已推出可在網路瀏覽器上使用的多國語言服務,現在進一步推出這套官方應用程式以饗數量不斷成長的國際觀光客,為他們提供從規劃行程到在日本實際停留期間的進階搜尋和訂位體驗。該應用程式的下載次數在推出當月便躍升「國際觀光客選用的日本美食搜尋應用程式」類第一名 (*2)。 應用程式下載連結:...
