

Newsroom
Sorted by: Latest
-
Riassunto: Wolters Kluwer amplia il suo spazio di lavoro Libra AI con contenuti giuridici autorevoli forniti dall'importante casa editrice svizzera Stämpfli
ALPHEN AAN DEN RIJN, Paesi Bassi--(BUSINESS WIRE)--Wolters Kluwer Legal & Regulatory oggi ha annunciato l'espansione di Libra by Wolters Kluwer, il suo spazio di lavoro legale basato sull'AI, per includere contenuti giuridici professionali forniti da Stämpfli Publishers, una delle case editrici di testi legali più autorevoli della Svizzera. Di conseguenza, i professionisti svizzeri del settore legale che utilizzano Libra by Wolters Kluwer ottengono l'accesso diretto alla letteratura legale...
-
Samenvatting: Wolters Kluwer breidt zijn portaal Libra AI uit met gezaghebbende Zwitserse juridische content van de vooraanstaande uitgeverij Stämpfli
ALPHEN AAN DEN RIJN, Nederland--(BUSINESS WIRE)--Wolters Kluwer Legal & Regulatory kondigde vandaag de uitbreiding aan van Libra by Wolters Kluwer, het juridische portaal van de uitgeverij aangestuurd door AI, om professionele juridische content te integreren van Stämpfli Publishers, een van de hoogst aangeschreven juridische uitgeverijen van Zwitserland. Op die manier krijgen Zwitserse juridische professionals die Libra by Wolters Kluwer gebruiken rechtstreeks toegang tot de juridische lit...
-
Resumen: Wolters Kluwer amplía Libra, su espacio de trabajo jurídico impulsado por IA, con contenido jurídico suizo de referencia de la editorial Stämpfli
ALPHEN AAN DEN RIJN, Países Bajos--(BUSINESS WIRE)--Wolters Kluwer Legal & Regulatory anunció hoy la ampliación de Libra by Wolters Kluwer, su espacio de trabajo jurídico impulsado por IA, con la incorporación de contenidos jurídicos profesionales de Stämpfli Publishers, una de las editoriales jurídicas más prestigiosas de Suiza. Gracias a esta incorporación, los profesionales del derecho en Suiza que utilizan Libra by Wolters Kluwer podrán acceder directamente a las obras y publicaciones j...
-
Vertex Presents New Data on CASGEVY®, Including First European Presentation of Data in Children Ages 5–11, at the European Hematology Association Congress and Announces Additional Global Regulatory Submissions
BOSTON--(BUSINESS WIRE)--Vertex Pharmaceuticals Incorporated (Nasdaq: VRTX) today announced data demonstrating the clinical benefits of CASGEVY® (exagamglogene autotemcel) in people ages 5 years and older living with severe sickle cell disease (SCD) or transfusion-dependent beta thalassemia (TDT). The results, from pivotal studies in children ages 5–11, show that the efficacy and safety outcomes in this age group are consistent with the transformative profile established in adult and adolescent...
-
AHS Properties erwirbt das Shangri-La Hotel für 1,1 Milliarden AED im Rahmen einer wegweisenden Transaktion an der Sheikh Zayed Road
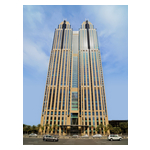
DUBAI, Vereinigte Arabische Emirate--(BUSINESS WIRE)--AHS Properties gab heute den Erwerb des Shangri-La Hotels für 1,1 Milliarden AED bekannt – eine der größten Einzelobjekt-Immobilientransaktionen der jüngeren Geschichte. Die von Mismak Asset Management erworbene Immobilie festigt eine der konzentriertesten Investitionen des privaten Sektors in die nächste Dekade der Sheikh Zayed Road. Das Shangri-La Hotel ist ein 43-stöckiger, 200 Meter hoher Turm an der Sheikh Zayed Road und war bei seiner...

-
AHS Properties adquiere el hotel Shangri-La por AED 1100 millones en una transacción emblemática en la avenida Sheikh Zayed
DUBÁI, Emiratos Árabes Unidos--(BUSINESS WIRE)--AHS Properties anunció hoy la adquisición del hotel Shangri-La por 1100 millones de dirhams emiratíes, lo que la convierte en una de las mayores transacciones inmobiliarias de un solo activo registradas en la historia reciente. Adquirida a Mismak Asset Management, la transacción consolida una de las apuestas más concentradas del sector privado en la próxima década de la avenida Sheikh Zayed. El hotel Shangri-La es una torre de 43 plantas y 200 met...

-
AHS Properties以11亿迪拉姆收购香格里拉酒店,完成谢赫扎耶德路标志性交易
阿联酋迪拜--(BUSINESS WIRE)--(美国商业资讯)-- AHS Properties今日宣布以11亿迪拉姆的价格收购香格里拉酒店,这是近年来有记录的最大单体资产房地产交易之一。 该资产是从Mismak Asset Management手中购得,这笔交易巩固了私营部门对谢赫扎耶德路未来十年前景的一次高度集中的投资。 香格里拉酒店是位于谢赫扎耶德路上的一栋43层、高200米的大厦,是2003年完工时该走廊首批开业的五星级酒店之一。 此次收购为AHS Properties的投资组合增添了一个标志性的核心资产,其投资组合已包括AHS Tower以及AHS City,前者是一个谢赫扎耶德路上近期售罄的甲级商业开发项目,后者是开发商在该走廊的旗舰总体规划综合用途社区,预计总开发价值达250亿迪拉姆。 这三项资产共同构成了走廊式的垂直布局战略:AHS Tower、AHS City,以及现在的香格里拉酒店。这些资产的总规模占据了AHS Properties截至2026年年底500亿迪拉姆项目管线的很大一部分。 AHS Properties创始人兼首席执行官Abbas Sajwani表示:...
-
AHSプロパティーズ、シャングリ・ラ ホテルを11億UAEディルハムで買収し、シェイク・ザイード・ロードのランドマークとも言える取引を実現
アラブ首長国連邦ドバイ--(BUSINESS WIRE)--(ビジネスワイヤ) -- AHSプロパティーズは、シャングリ・ラ ホテルを11億UAEディルハムで買収したと発表しました。これは、近年の不動産買収の中でも最大規模の案件の1つです。 ミスマック・アセット・マネジメントからの今回の買収は、シェイク・ザイード・ロードの今後10年間における、民間セクターによる最も集中的な投資の1つを確固たるものにするものです。 シャングリ・ラ ホテルは、シェイク・ザイード・ロード沿いに建つ43階建て、高さ200メートルのタワーで、2003年の竣工当時、このエリアで最初に開業した5つ星ホテルの1つでした。 今回の買収により、AHSタワー(シェイク・ザイード・ロード沿いの最近完売したグレードA商業施設)や、開発会社がシェイク・ザイード・ロード沿いに手掛ける旗艦プロジェクトである複合用途開発コミュニティのAHSシティ(総開発額:250億UAEディルハム)といった既存のポートフォリオに、象徴的な資産を追加するものです。 これら3つの資産、すなわちAHSタワー、AHSシティ、そして今回のシャングリ・ラ ホテ...

-
AHS Properties neemt het Shangri-La Hotel over voor 1,1 miljard AED in een mijlpaaltransactie aan Sheikh Zayed Road
Dubai, Verenigde Arabische Emiraten--(BUSINESS WIRE)--AHS Properties heeft vandaag de overname van het Shangri-La Hotel voor AED 1,1 miljard aangekondigd, een van de grootste transacties met één enkel vastgoedobject uit de recente geschiedenis. Met deze overname van Mismak Asset Management verstevigt AHS Properties een van de meest geconcentreerde investeringen van de particuliere sector in de toekomstige ontwikkeling van Sheikh Zayed Road. Het Shangri-La Hotel is een 200 meter hoge toren met 4...

-
AHS Properties adquire o Shangri-La Hotel por 1,1 bilhão de AED em transação histórica na Sheikh Zayed Road
DUBAI, Emirados Árabes Unidos--(BUSINESS WIRE)--A AHS Properties anunciou hoje a aquisição do Shangri-La Hotel por 1,1 bilhão de AED, uma das maiores transações imobiliárias envolvendo um único ativo registradas na história recente. Adquirido da Mismak Asset Management, o empreendimento consolida uma das maiores apostas do setor privado para a próxima década na Sheikh Zayed Road Com 43 andares e 200 metros de altura, o Shangri-La Hotel é uma torre na Sheikh Zayed Road. Foi um dos primeiros hoté...
