Newsroom
Sorted by: Latest
-
JCÖNTENTS “Llegue rápidamente a su destino, incluso si no domina el idioma”
KIOTO, Japón--(BUSINESS WIRE)--¡JCÖNTENTS lanza la app gratuita GOPin para smartphones el 1 de junio! ¡JCÖNTENTS Co., Ltd. (prefectura de Kioto; representante: Takamasa Yoshimitsu) lanzó la app gratuita GOPin para smartphones el 1 de junio! GOPin es una aplicación de navegación multilingüe completamente nueva que conecta a los turistas que visitan Japón con los taxistas locales a través de códigos QR. Lo único que tienen que hacer los usuarios es seleccionar en el mapa el destino y mostrar el c...

-
JCÖNTENTS “Chegue rapidamente ao seu destino, mesmo com barreiras linguísticas.”
KYOTO, Japão--(BUSINESS WIRE)--A JCÖNTENTS lançou gratuitamente o aplicativo GOPin para smartphones em 1.º de junho! A JCÖNTENTS Co., Ltd. (Província de Quioto; representante: Takamasa Yoshimitsu) lançou gratuitamente o aplicativo GOPin para smartphones em 1.º de junho! O GOPin é um aplicativo multilíngue completamente novo que conecta turistas visitando o Japão com motoristas de táxi locais através de códigos QR. Para os usuários, basta selecionar onde eles querem ir no mapa e mostrar o código...

-
JCÖNTENTS « Rendez-vous où vous voulez, même si la langue est un obstacle. »
KYOTO, Japon--(BUSINESS WIRE)--JCÖNTENTS lance l'application gratuite GOPin pour smartphones le 1er juin ! La société JCÖNTENTS Co., Ltd. (préfecture de Kyoto ; représentant : Takamasa Yoshimitsu) a lancé le 1er juin l'application gratuite GOPin pour smartphones ! GOPin est une toute nouvelle application de navigation multilingue qui met en relation les touristes en visite au Japon avec les chauffeurs de taxi locaux grâce à des codes QR. Il suffit aux utilisateurs de sélectionner leur destinati...

-
JCÖNTENTS „Auch trotz Sprachbarriere schnell ans Ziel.“
KYOTO, Japan--(BUSINESS WIRE)--JCÖNTENTS veröffentlicht am 1. Juni die kostenlose Smartphone-App „GOPin“! JCÖNTENTS Co., Ltd. (Präfektur Kyoto; Vertreter: Takamasa Yoshimitsu) hat am 1. Juni die kostenlose GOPin-App für Smartphones veröffentlicht! GOPin ist eine völlig neue, mehrsprachige Navigations-App, die Touristen in Japan über QR-Codes mit lokalen Taxifahrern verbindet. Die Nutzer müssen lediglich auf der Karte den gewünschten Ort auswählen und den QR-Code vorzeigen. Der Taxifahrer scannt...

-
Omdia:2026年世界盃備貨潮開啟,第一季電視出貨量較去年同期成長6%
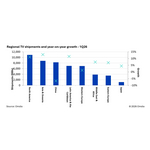
倫敦--(BUSINESS WIRE)--(美國商業資訊)-- 根據Omdia最新發表的《2026年第一季,電視機(新興技術)市場追蹤報告:歷史資料》顯示,隨著零售商在即將到來的2026年世界盃前加大庫存補充力度,2026年第一季全球電視出貨量較去年同期成長6%,達到5030萬台。除中國大陸外,全球所有地區均實現較去年同期成長。2025年國內刺激政策結束後,中國大陸市場的本土需求依然疲軟。 開發中經濟體與北美引領全球成長 2026年第一季成長最快的兩個地區均為開發中經濟體,分別為亞太及大洋洲(成長13%)和拉丁美洲(成長12%)。這主要歸功於中國電視廠商在中國國內市場持續疲軟的情況下,將更多出貨量轉向了這些海外地區。 儘管北美市場已高度飽和,但仍實現了尤為強勁的出貨量成長(成長11%)。多種因素共同促成了這一成長,尤其是在美國市場。身為今年世界盃的共同主辦國,美國市場為零售商提供了大張旗鼓促銷電視的絕佳機會。與此同時,零售商之間的競爭依然激烈。這一點在Walmart身上體現得最為明顯,其策略目標是透過Onn.和Vizio電視擴大Vizio OS的涵蓋範圍,並透過廣告帶來衍生收入,而不再...

-
Omdia:2026年第一季度,电视出货量增长6%,世界杯备货周期正式启动
伦敦--(BUSINESS WIRE)--(美国商业资讯)-- 根据Omdia最新发布的《2026年第一季度,电视机(新兴显示技术)市场追踪报告》数据显示,受零售商为即将到来的2026年世界杯提前备货推动,2026年第一季度全球电视出货量同比增长6%,达到5030万台。除中国大陆外,全球所有地区均实现同比增长。中国大陆市场则因2025年国内刺激政策效应减弱后本地需求持续疲软,成为唯一出现下滑的地区。 发展中经济体和北美推动全球市场增长 2026年第一季度,增长最快的两个地区均为发展中经济体。其中,亚洲及大洋洲地区同比增长13%,拉丁美洲同比增长12%。由于中国国内市场需求疲弱,中国厂商将更多电视产品出口至这些地区,从而带动了当地市场增长。 北美地区同样实现了尤为强劲的出货增长(同比增长11%),尽管其本身已是高度饱和的市场。这一增长由多重因素共同推动,尤其是在美国市场表现突出。作为今年世界杯的联合主办国,美国市场为零售商提供了明确的契机,可以更积极地推广电视产品。与此同时,零售商之间的竞争依然激烈。其中最典型的是沃尔玛,其战略目标是扩大Vizio OS(搭载于Onn.与Vizio电视)...

-
オムディア(Omdia)、2026年ワールドカップに向けた在庫積み増し開始で、2026年第1四半期のテレビ出荷台数が6%増と発表
ロンドン--(BUSINESS WIRE)--(ビジネスワイヤ) -- (ビジネスワイヤ) -- オムディア(Omdia)の最新レポート「TV Sets (Emerging Technologies) Market Tracker: History – 1Q26」によると、2026年ワールドカップ開催を前に小売業者が在庫を積み増したことを背景に、2026年第1四半期(1Q26)の世界のテレビ出荷台数は前年同期比(YoY)6%増の5,030万台となった。地域別では、中国本土を除くすべての地域で前年同期比成長を記録した。但し、中国本土では、2025年の国内景気刺激策後も現地需要低迷が続いている。 新興国市場と北米が世界成長を牽引 2026年第1四半期に最も急成長した2つの地域は、いずれも新興経済圏とされており、アジア・オセアニア地域(13%増)とラテンアメリカ(12%増)は、中国メーカーが国内市場の低迷を受けてこれらの地域への出荷を追加的に振り向けたことで恩恵を受けた。 また、高度に成熟した市場である北米でも、特に堅調な出荷成長(11%増)を記録した。複数の要因がこの成長に寄与しており、...
-
Almonty Industries Prices Oversubscribed US$700 Million Convertible Senior Notes Offering
DILLON, Mont.--(BUSINESS WIRE)--Almonty Industries Inc. (“Almonty” or the “Company”) (Nasdaq: ALM) (TSX: AII) (ASX: AII) (Frankfurt: ALI1) today announced the pricing of its oversubscribed offering of US$700,000,000 aggregate principal amount of 2.25% convertible senior notes due 2031 (the “notes”) in a private offering to persons reasonably believed to be qualified institutional buyers pursuant to Rule 144A under the Securities Act of 1933, as amended (the “Securities Act”). The issuance and s...
-
Samenvatting: JCÖNTENTS “Zip naar je bestemming, zelfs als je de taal niet spreekt.”
KYOTO, Japan--(BUSINESS WIRE)--JCÖNTENTS lanceert de release van de gratis GOPin smartphone-app op 1 juni! JCÖNTENTS Co., Ltd. (Kyoto-prefectuur; vertegenwoordiger: Takamasa Yoshimitsu) lanceerde op 1 juni de release van de gratis GOPin-app voor smartphones! GOPin is een volledig nieuwe, meertalige navigatie-app die toeristen op bezoek in Japan aan de hand van QR-codes met lokale taxibestuurders verbindt. Het enige wat gebruikers moeten doen, is op de kaart selecteren waar ze naartoe willen en...

-
Riassunto: JCÖNTENTS “Vai alla tua destinazione, anche se non parli la lingua”.
KYOTO, Giappone--(BUSINESS WIRE)--JCÖNTENTS rilascia GOPin, l'app gratuita per lo smartphone il 1° giugno! JCÖNTENTS Co., Ltd. (Kyoto Prefecture; Rappresentante: Takamasa Yoshimitsu) rilascia l'app gratuita GOPin per gli smartphone il 1° giugno! GOPin è un'app di navigazione multilingue completamente nuova che connette i turisti che visitano il Giappone con i tassisti locali attraverso un QR code. Gli utenti non dovranno far altro che scegliere dove vogliono andare sulla mappa e mostrare il QR...