

Newsroom
Sorted by: Latest
-
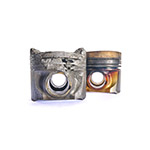
Lubrizol’s Whitepaper Highlights Critical Risks Behind “Suitable for Use” Engine Oils
CLEVELAND--(BUSINESS WIRE)--Lubrizol, a global specialty chemicals leader, today released its latest whitepaper, The Importance of Testing: Analysing Quality, Validation Processes and Reliability. The paper uncovers stark performance gaps between self-declared “Suitable for Use” (SFU) engine oils and those that carry formal OEM approvals, urging the industry to prioritise verified performance over unproven label claims. The Importance of Testing: Analysing Quality, Validation Processes and Reli...
-
The Law Offices of Frank L. Branson Again Receives Texas Super Lawyers Honors
DALLAS--(BUSINESS WIRE)--Five attorneys with the Law Offices of Frank L. Branson, led by the firm’s founder, have been selected to the 2026 edition of Texas Super Lawyers for excellence in plaintiffs general personal injury cases. Frank Branson, a member of the Super Lawyers list since its 2003 debut, is joined by Debbie D. Branson, John T. Burkhead, Tim Newsom and Wendell P. (Chip) Martens. This is the 18th appearance for Ms. Branson, the second for Mr. Burkhead, the 21st for Mr. Newsom, and t...
-
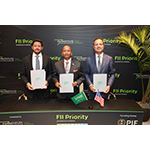
ADDING MULTIMEDIA Patel Family Office and AHQ Launch $1bn ‘AYARA’ Hospitality Platform to Develop 50 Hotels in Saudi Arabia
MIAMI--(BUSINESS WIRE)--Patel Family Office, a US investment enterprise, and Abdel Hadi A. Al-Qahtani & Sons [AHQ], a Saudi industrial conglomerate, have signed a USD $1 billion deal to establish AYARA, a vertically integrated hospitality platform that will develop a network of 50 international brand-name business hotels across Saudi Arabia by 2029. AYARA will deliver standardized, branded business hotels at scale, serving the Kingdom’s booming corporate and business travel sector. Under th...
-
Bellevue and Seattle Connect with New Crosslake Light Rail
BELLEVUE, Wash.--(BUSINESS WIRE)--Bellevue enters a new era of regional connectivity with the opening of Sound Transit’s Crosslake Connection, linking downtown Bellevue directly to Seattle and providing seamless, car-free access to Seattle-Tacoma International Airport (SEA) and destinations across the Puget Sound region. A world's first, visitors can now enjoy a scenic view of Lake Washington while crossing a floating bridge on board the carbon-free light rail system, making Bellevue a natural...

-
Pierre Turns Financial Management Into a Simple Conversation -- No Spreadsheets, No Confusing Charts
SUNNYVALE, Calif.--(BUSINESS WIRE)--There’s a paradox in personal finance: the more financial management tools someone downloads, the less they understand their own money. Spreadsheets require discipline. Banking apps deliver charts that no one interprets. Reports arrive too late. The result is always the same: the uncomfortable feeling that money is slipping away without explanation. Pierre, an AI assistant that talks to your money, flips this logic. Instead of asking you to organize your fina...

-
PLUS Investors Have Opportunity to Join ePlus inc. Fraud Investigation with the Schall Law Firm
LOS ANGELES--(BUSINESS WIRE)--PLUS Investors Have Opportunity to Join ePlus inc. Fraud Investigation with the Schall Law Firm...
-
AndHealth Rheumatology Welcomes Dr. Veronica Heitsch to Practice in Ohio
COLUMBUS, Ohio--(BUSINESS WIRE)--AndHealth has welcomed Dr. Veronica Heitsch, MD, MBOE, as Rheumatologist and Clinical Quality Lead for AndHealth. Dr. Heitsch, a board-certified rheumatologist and internal medicine physician with specialized training in adult rheumatology, is now accepting patients in Ohio and Indiana as part of AndHealth Rheumatology. Appointments can be scheduled by calling 614-526-4551, by emailing appointments@andhealth.com, or by visiting https://andhealth.com/rheumatology...

-
VITL Investors Have Opportunity to Lead Vital Farms, Inc. Securities Fraud Lawsuit with the Schall Law Firm
LOS ANGELES--(BUSINESS WIRE)--VITL Investors Have Opportunity to Lead Vital Farms, Inc. Securities Fraud Lawsuit with the Schall Law Firm...
-
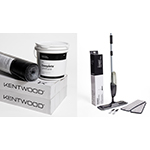
Metropolitan Systems Complete™: Your Partner for Flawless Flooring Projects
VANCOUVER, British Columbia--(BUSINESS WIRE)--Metropolitan Floors is releasing a fully integrated flooring solution – Metropolitan Systems Complete™ – to help builders, installers, and architects complete flawless flooring projects. With products for subfloor prep, installation adhesives, and flooring care & maintenance, the system eliminates any guesswork by providing products that work together in perfect harmony with Kentwood and Evoke flooring across North America. Metropolitan Systems...
-
Archer Foodservice Partners to Acquire Sterno Foodservice Business
ROSEMONT, Ill.--(BUSINESS WIRE)--Wynnchurch Capital, L.P. (“Wynnchurch”), a leading middle-market private equity firm, today announced that Archer Foodservice Partners (“Archer”), a leading provider of foodservice consumables and parent entity of companies Handgards, Inno-Pak, and Fineline Settings, has signed a definitive agreement to acquire the foodservice business of SternoCandleLamp Holdings, Inc. (“Sterno” or the “Company”) from Compass Diversified (NYSE: CODI). The transaction represents...