

Newsroom
Sorted by: Latest
-
Latigo Biotherapeutics Announces New England Journal of Medicine Publication of Positive LTG-001 Abdominoplasty Clinical Trial Results in Moderate-to-Severe Acute Pain
THOUSAND OAKS, Calif.--(BUSINESS WIRE)--Latigo Biotherapeutics, Inc. (Latigo), a clinical-stage biopharmaceutical company developing innovative non-opioid pain medicines, today announced the publication of positive results from the abdominoplasty clinical trial evaluating LTG-001 for the treatment of moderate-to-severe acute postoperative pain as an original research article in the New England Journal of Medicine (NEJM). LTG-001 is an investigational selective Nav1.8 inhibitor, part of a new cl...
-
Sonos Appoints Chris Shackelton to Board of Directors
SANTA BARBARA, Calif.--(BUSINESS WIRE)--Sonos, Inc. (Nasdaq: SONO) today announced the appointment of Chris Shackelton to its Board of Directors, effective July 28, 2026. The appointment is the latest step in the evolution of the Sonos Board, which has recently added directors with targeted expertise in areas central to the company. As Sonos enters its next chapter, Mr. Shackelton adds the perspective of a long-term investor, with experience across strategy, financial markets, and capital alloc...
-
Onyx Security Raises $113M Series B to Control Advanced AI, Quadrupling Revenue since Stealth Launch Four Months Ago
NEW YORK & TEL AVIV, Israel--(BUSINESS WIRE)--Onyx Security, the AI control company, announced a $113 million Series B funding round led by Bessemer Venture Partners, with participation from Cyberstarts, TCV, Conviction, FirstMark, Vintage, QuantumLight and G Squared. This brings the company’s total funding to $153M since its founding exactly two years ago. Since coming out of stealth four months ago, Onyx has grown revenue fourfold, and in June, Anthropic announced its integration with Onyx to...
-
NewMarket Corporation Reports Second Quarter and First Half 2026 Results
RICHMOND, Va.--(BUSINESS WIRE)--NewMarket Corporation (NYSE:NEU) Chairman and Chief Executive Officer, Thomas E. Gottwald, released the following earnings report of the Company’s operations for the second quarter and first half of 2026. Net income for the second quarter of 2026 was $133.8 million, or $14.54 per share, compared to net income of $111.2 million, or $11.84 per share, for the second quarter of 2025. For the first half of 2026, net income was $251.8 million, or $27.14 per share, comp...
-
Vista Gold Announces Second Quarter 2026 Financial Results
DENVER--(BUSINESS WIRE)--Vista Gold Corp. (NYSE American and TSX: VGZ) today announced its unaudited financial results for the quarter ended June 30, 2026, with cash totaling $49.5 million at quarter-end. All dollar amounts in this press release are in U.S. dollars. Frederick H. Earnest, President and CEO of Vista Gold, stated, “The second quarter marked another period of disciplined execution as we continued to advance Mt Todd toward development. We achieved meaningful progress on permitting,...
-
Entegris Announces Changes to Board of Directors
BILLERICA, Mass.--(BUSINESS WIRE)--Entegris, Inc. (Nasdaq: ENTG), a global leader in advanced materials and purity solutions for the semiconductor industry, today announced the appointment of Robert A. Bruggeworth, President and Chief Executive Officer of Qorvo, to the Board, effective August 3, 2026. In addition, the Company announced that Bertrand Loy, Executive Chair of the Board of Directors, will retire from Entegris on July 31, 2026. At that time, James F. Gentilcore, currently the Compan...
-
KBRA Assigns Preliminary Ratings to Sequoia Mortgage Trust 2026-10 (SEMT 2026-10)
NEW YORK--(BUSINESS WIRE)--KBRA assigns preliminary ratings to 102 classes of mortgage pass-through certificates from Sequoia Mortgage Trust 2026-10 (SEMT 2026-10), a $740.4 million prime RMBS transaction. The pool is comprised of 586 first-lien, fully amortizing fixed rate mortgages with mostly 30-year maturity terms. The collateral is characterized by a weighted average (WA) original credit score of 777 and moderate borrower equity, with a WA original LTV and WA original CLTV of 69.8% and 69....
-
CSB Financial Inc. Completes Initial Public Offering
BETHEL, Ohio--(BUSINESS WIRE)--CSB Financial Inc. (the “Company”), the stock holding company for Community Savings Bank (the “Bank”), completed its initial public offering in connection with the Bank’s conversion from the mutual-to-stock form of organization, effective today. The Company sold 1,375,435 shares of common stock to the Bank’s eligible depositors and other eligible subscribers in a Subscription Offering, which includes 112,235 shares sold to the Bank’s Employee Stock Ownership Plan,...
-
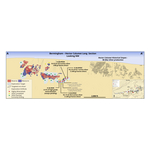
Hecla Reports Excellent Q2 2026 Exploration Results at Keno Hill, New Veins Discovered at Midas, and Positive Definition Results at Greens Creek
COEUR D'ALENE, Idaho--(BUSINESS WIRE)--Hecla Reports Excellent Q2 2026 Exploration Results...
-
Cactus Announces Second Quarter 2026 Results
HOUSTON--(BUSINESS WIRE)--Cactus, Inc. (NYSE: WHD) (“Cactus” or the “Company”) today announced financial and operating results for the second quarter of 2026. Second Quarter Highlights Revenue of $449.5 million and operating income of $83.6 million; Net income of $61.4 million and diluted earnings per Class A share of $0.70; Adjusted net income(1) of $75.1 million and diluted earnings per share, as adjusted(1) of $0.93; Net income margin of 13.7% and adjusted net income margin(1) of 16.7%; Adju...