Newsroom
Sorted by: Latest
-
Pan American Silver Discovers New High-Grade Veins at the La Colorada Mine
VANCOUVER, British Columbia--(BUSINESS WIRE)--Pan American Silver Corp. (NYSE: PAAS) (TSX: PAAS) ("Pan American" or the "Company") reports new drill results from the southeastern and eastern Candelaria zones of the La Colorada mine in Zacatecas, Mexico. Exploration drilling between the Cristina and San Gerónimo systems has resulted in the discovery of at least four new veins and associated contact-related replacement mineralization featuring wide mineralized intercepts with high silver, gold, a...
-
Bonterra Acquires Deed to Redefine Corporate Philanthropy
AUSTIN, Texas--(BUSINESS WIRE)--Bonterra™, a leading provider of ethical AI technology for social good organizations, today announced it has acquired Deed, known for its people-first employer CSR experience, to deliver a modern, intelligent employee engagement experience to raise the standards of corporate philanthropy. By integrating Deed’s AI-forward engagement platform with Bonterra’s grantmaking solutions, customers benefit from a single, connected view of corporate impact across giving, vo...
-
Organigram Global Expands FAST™ Innovation Platform with SHRED Shotz, Leveraging SHRED Brand Equity
TORONTO--(BUSINESS WIRE)--Organigram Global Inc. (NASDAQ: OGI) (TSX: OGI), (the “Company” or “Organigram”), Canada’s #1 cannabis company by market share1 is pleased to announce the launch of SHRED Shotz, a compact, single-serve 65ml cannabis beverage powered by FAST™, Organigram’s fast-acting nanoemulsion technology platform designed to deliver a 15-minute onset2. This launch reflects Organigram’s focus on differentiated innovation while leveraging the scale of SHRED, one of the Company’s best-...

-
Palladyne AI Reports Fourth Quarter and Full Year 2025 Results and Reiterates 2026 Revenue Guidance of $24 to $27 Million
SALT LAKE CITY--(BUSINESS WIRE)--Palladyne AI Reports Fourth Quarter and Full Year 2025 Results and Reiterates 2026 Revenue Guidance of $24 to $27 Million...
-
SELECT MEDICAL STOCK ALERT: Does $16.50 Per Share Represent a Fair Shareholder Buyout Price? Kaskela Law Firm Announces Investigation into Fairness of Buyout Offer and Encourages Investors to Contact the Firm – SEM
PHILADELPHIA--(BUSINESS WIRE)--Kaskela Law LLC is investigating the recently announced buyout of Select Medical Holdings Corp. (“Select Medical”) (NYSE: SEM) shareholders to determine whether the $16.50 per share buyout offer is fair to the company’s investors or if it undervalues the company’s shares. Click here for additional information: https://kaskelalaw.com/case/select-medical/ On March 2, 2026, Select Medical announced that it had agreed to be acquired by an investment consortium at a pr...
-
UpKeep Launches Studio, an App Platform That Lets Maintenance Teams Build Their Own Software
LOS ANGELES--(BUSINESS WIRE)--UpKeep, the leading mobile-first Asset Operations Management platform, today announced the launch of UpKeep Studio, an app platform that gives maintenance and operations teams the ability to build, install, and run custom software applications directly inside their CMMS, without writing a single line of code. CMMS platforms handle work orders, assets, and parts, but the supporting workflows teams depend on (safety tracking, compliance, inspections, fleet management...
-
Trinity Hunt Partners Establishes New Economic Consulting and Dispute Advisory Platform With Investment in Berger Consulting Group
DALLAS--(BUSINESS WIRE)--Trinity Hunt Partners, a growth-oriented private equity firm, is pleased to announce an investment in Berger Consulting Group (“Berger”). The partnership launches Trinity Hunt’s economic consulting and dispute advisory platform, targeting growth in economic damages analysis, forensic accounting, and valuation service lines. This platform will draw on the firm’s extensive experience in the legal services industry and its proven buy-and-build strategy. Founded in 2013, Be...

-
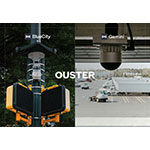
Ouster Accelerates Software Adoption in 2025 with Record Bookings and Global Expansion
SAN FRANCISCO--(BUSINESS WIRE)--Ouster, Inc. (Nasdaq: OUST) (“Ouster” or the “Company”), a leader in sensing and perception for Physical AI, today announced significant commercial momentum for its software offerings, driven by growing global demand for its Ouster Gemini and Ouster BlueCity solutions. Ouster doubled software-attached bookings in 2025, reflecting accelerated commercial adoption of its lidar-powered Physical AI solutions. The Company expanded contracted deployments for Ouster Gemi...
-
Ooma to Host Investor Meetings at the 38th Annual ROTH Conference
SUNNYVALE, Calif.--(BUSINESS WIRE)--Ooma, Inc. (NYSE: OOMA), a smart communications platform for businesses and consumers, today announced the following conference participation: What: The 38th Annual ROTH Conference, in-person one-on-one meetings When: March 23-24, 2026 Who: Ooma CEO Eric Stang and CFO Shig Hamamatsu Where: Dana Point, California Interested parties should contact their ROTH sales representative for further details and meeting opportunities or, to submit a registration request,...
-
Genesis Energy, L.P. Announces Early Results and Initial Settlement Date for Tender Offer for Any and All of Its 7.750% Senior Notes Due 2028
HOUSTON--(BUSINESS WIRE)--Genesis Energy, L.P. (NYSE: GEL) today announced that receipt of tenders for an aggregate principal amount of $415,942,000 of our outstanding 7.750% senior notes due 2028 (the “Notes”) that we co-issued with our subsidiary, Genesis Energy Finance Corporation in connection with its previously announced cash tender offer (such transaction, the “Tender Offer”) to purchase any and all of the aggregate principal amount outstanding of the Notes, as of 5:00 p.m., New York Cit...