

Newsroom
Sorted by: Latest
-
韩国文化产业振兴院 Korea Game Pavilion 参展 2026 ChinaJoy BTOC
上海--(BUSINESS WIRE)--在 2026 ChinaJoy BTOC 的 KOREA GAME PAVILION,您将有机会与 10 家极具潜力的韩国优秀游戏企业面对面交流,发掘最新创意,探索合作商机。...

-
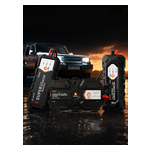
ANCEL Introduces Super Capacitor Jump Starter Solutions for Daily Vehicles, Diesel Vehicles, and Heavy-Duty Applications
MARIETTA, Ga.--(BUSINESS WIRE)--ANCEL expands its Super Starter lineup with the BS200, BS300, and BS400 super capacitor jump starters....
-
Faraday Future Founder and Global CEO YT Jia Shares Weekly Investor Update Including the EAI Robotics Summer Camp, Announcement of the Launch of the EAI-EDU Nationwide Replication at Scale Strategy and Improvements to FF’s Capital Market Performance
LOS ANGELES--(BUSINESS WIRE)--Faraday Future Intelligent Electric Inc. (NASDAQ: FFAI) (“Faraday Future”, “FF” or the “Company”), a California-based global Embodied AI (EAI) ecosystem company, today shared a weekly business update from YT Jia, Founder and Global CEO of FF. “Hello everyone, and welcome to Weekly Report Issue 65. Today, I’d like to begin by sharing some exciting progress in our EAI education ecosystem. Then, I’ll offer some reflections on our recent capital market performance, alo...

-
Best’s Market Segment Report: AM Best Maintains Stable Outlook on Vietnam’s Non-Life Insurance Segment
SINGAPORE--(BUSINESS WIRE)--AM Best is maintaining its stable outlook on Vietnam’s non-life insurance segment, citing robust demand, technology adoption and healthy macroeconomic factors. The Best’s Market Segment Report, “Market Segment Outlook: Vietnam Non-Life Insurance,” states that the country’s positive macroeconomic performance has been underpinned by buoyant electronic exports, and increasing foreign direct investment, driven by the global investment boom in artificial intelligence-rela...
-
Kogan Increases Approval Rates and Improves Customer Experience with Riskified
MELBOURNE, Australia--(BUSINESS WIRE)--Kogan protects profits and improves customer experience with Riskified, achieving approval rates exceeding 98% and $1.5M in annual savings...
-
Brown-Forman Board Issues Statement
LOUISVILLE, Ky.--(BUSINESS WIRE)--Brown-Forman Corporation (NYSE: BFA, BFB) today announced that its Board of Directors has received an unsolicited proposal from Sazerac to acquire Brown-Forman, and, taking into consideration Wolf Pen Branch, LP’s view as noted below, has concluded that Sazerac's proposal is not actionable. Wolf Pen Branch, LP, a collection of Brown family members representing the majority of Brown-Forman Class A shares, said, “As fourth-, fifth- and sixth-generation shareholde...
-
Alkegen Commences Prepackaged Chapter 11 Process to Implement Previously Announced Restructuring Support Agreement
IRVING, Texas--(BUSINESS WIRE)--Alkegen (the “Company”), a leading specialty materials manufacturer, today announced that it has voluntarily commenced prepackaged chapter 11 cases in the U.S. Bankruptcy Court for the Northern District of Texas to implement the Restructuring Support Agreement ("RSA") that was previously announced on July 20, 2026. Under the terms of the RSA, Alkegen will eliminate approximately $3.1 billion of total debt and meaningfully improve its capital structure, positionin...
-
ALHC Investors Have Opportunity to Join Alignment Healthcare, Inc. Fraud Investigation with the Schall Law Firm
LOS ANGELES--(BUSINESS WIRE)--ALHC Investors Have Opportunity to Join Alignment Healthcare, Inc. Fraud Investigation with the Schall Law Firm...
-
PRCT Investors Have Opportunity to Lead PROCEPT BioRobotics Corporation Securities Fraud Lawsuit with the Schall Law Firm
LOS ANGELES--(BUSINESS WIRE)--PRCT Investors Have Opportunity to Lead PROCEPT BioRobotics Corporation Securities Fraud Lawsuit with the Schall Law Firm...
-
EquipmentShare.com Inc. Sued for Securities Law Violations - Contact the DJS Law Group to Discuss Your Rights – EQPT
LOS ANGELES--(BUSINESS WIRE)--EquipmentShare.com Inc. Sued for Securities Law Violations - Contact the DJS Law Group to Discuss Your Rights – EQPT...