

Newsroom
Sorted by: Latest
-
CoreWeave Announces Intention to Offer $3.5 Billion of Senior Notes
LIVINGSTON, N.J.--(BUSINESS WIRE)--CoreWeave, Inc. (Nasdaq: CRWV) (“CoreWeave”) announced today that it intends, subject to market and other customary conditions, to offer $3.5 billion (or euro equivalents) in aggregate principal amount of dollar-denominated and euro-denominated senior notes due 2032 (collectively, the “Notes”) in a private offering. The Notes will be guaranteed on a senior unsecured basis by certain wholly-owned subsidiaries of CoreWeave. CoreWeave intends to use the proceeds...

-
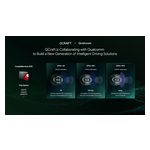
QCraft Demonstrates Urban NOA on Qualcomm's Latest Snapdragon Ride SoC, Targets 2026 Global Mass Production
WUXI, China--(BUSINESS WIRE)--QCraft demonstrated its urban NOA solution on Qualcomm's SA8650P platform in production vehicles, advancing toward global mass production in 2026....
-
Samenvatting: SLB organiseert de 2026 Digital Investor Day
HOUSTON--(BUSINESS WIRE)--SLB (NYSE: SLB) organiseert op woensdag 17 juni 2026 een Investor Day in New York. Op de investeerdersdag zal het management zijn visie geven op de digitale activiteiten van SLB, nu digitale technologieën en AI de energiesector steeds verder hervormen. Tijdens de presentatie ligt de nadruk op de geïntegreerde digitale strategie en het portfolio van SLB. De schaalbare groeimogelijkheden dankzij AI, het het financiële profiel en de vooruitzichten van het bedrijf worden o...
-
Esteban Ocon torna-se embaixador global da Ubigi Travel eSIM
PARIS--(BUSINESS WIRE)--A Ubigi, marca de conectividade eSIM da operadora móvel global Transatel (subsidiária do grupo NTT), anuncia a nomeação do piloto francês Esteban Ocon como embaixador de sua oferta Travel eSIM. A parceria reforça as ambições internacionais da marca e seu compromisso de oferecer a pessoas e empresas uma conectividade 4G/5G de alta performance e acessível em mais de 200 destinos ao redor do mundo. Pioneira em conectividade eSIM global desde 2017, a Ubigi registrou forte cr...
-
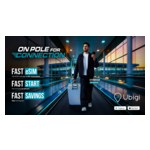
Esteban Ocon Named Global Ambassador for Ubigi Travel eSIM Service
PARIS--(BUSINESS WIRE)--Ubigi, the eSIM connectivity brand of global mobile operator Transatel (a subsidiary of the NTT Group), has chosen French racing driver Esteban Ocon to serve as the face of its Travel eSIM offering. This partnership highlights Ubigi’s international ambitions and reflects the brand’s promise to provide consumers and businesses with high-performance, accessible 4G/5G connectivity in more than 200 destinations worldwide. Launched in 2017, the pioneer in global eSIM connecti...

-
Esteban Ocon wird internationaler Markenbotschafter für Ubigi Travel eSIM
PARIS--(BUSINESS WIRE)--Ubigi, die eSIM-Marke des globalen Mobilfunkbetreibers Transatel (Tochtergesellschaft der NTT-Gruppe), hat den französischen Rennfahrer Esteban Ocon zum Markenbotschafter ihres Travel-eSIM-Angebots ernannt. Diese Partnerschaft unterstreicht die internationalen Ambitionen der Marke und ihr Versprechen, Privatpersonen und Unternehmen leistungsstarke und zugleich erschwingliche 4G/5G-Konnektivität in über 200 Reisezielen weltweit zu bieten. Der 2017 gegründete Pionier der g...

-
ESTEBAN OCON, NOUVEL AMBASSADEUR DU SERVICE TRAVEL ESIM UBIGI À L’INTERNATIONAL
PARIS--(BUSINESS WIRE)--Ubigi, la marque de connectivité eSIM de l’opérateur mobile mondial Transatel (filiale du groupe NTT), a choisi le pilote automobile français Esteban Ocon pour incarner son offre Travel eSIM. Ce partenariat marque les ambitions d’Ubigi à l’international et illustre la promesse de la marque qui offre au grand public comme aux entreprises une connectivité 4G/5G performante et accessible dans plus de 200 destinations à travers le monde. Lancé en 2017, le pionnier de la conn...

-
SLB、2026年「Digital Investor Day」を開催
ヒューストン--(BUSINESS WIRE)--(ビジネスワイヤ) -- SLB(NYSE:SLB)は、デジタル技術とAIがエネルギー業界を変革し続ける中、2026年6月17日(水)にニューヨークで投資家説明会を開催します。同説明会では、経営陣がSLBのデジタル事業に関するビジョンを説明します。プレゼンテーションでは、SLBの統合デジタル戦略とポートフォリオ、AIを活用して規模を拡大できる成長機会、財務面の特性と見通しを取り上げます。 SLBの最高経営責任者(CEO)であるオリビエ・ル・プェッシュは、米国東部時間(ET)の午前9時に登壇し、SLBのデジタル戦略と事業見通しについて説明します。SLBの最高財務責任者(CFO)であるステファン・ビゲは、米国東部時間の午前11時頃に登壇し、SLBのデジタル事業の財務面の特性、市場機会、SLBが掲げる2030年に向けたデジタル分野の目標について説明します。 ル・プェッシュとビゲに加え、各部門の責任者も登壇し、顧客の変革を推進するミッション・クリティカルなプラットフォームを基盤として、デジタル事業が競合他社とどのように差別化されているかについ...
-
Anocca has Dosed First Patients with Precision TCR-T Cell Therapy Targeting Mutant KRAS in Pancreatic Cancer
SÖDERTÄLJE, Sweden--(BUSINESS WIRE)--Anocca AB (‘Anocca’ or the ‘Company’), a clinical-stage biotechnology company developing advanced T-cell immunotherapies, today announced the successful dosing of the first patients across multiple clinical sites with ANOC-001, a novel T cell receptor-modified T cell therapy (TCR-T)[1] targeting KRAS G12V mutations in an aggressive form of pancreatic cancer. ANOC-001 is the first product to enter Anocca’s VIDAR-1 clinical programme, which focuses on pancreat...
-
Pleo Announces New Agentic Capabilities, Changing the Face of Financial Management and Decision-Making
LONDON--(BUSINESS WIRE)--Pleo, Europe's first and most trusted strategic finance platform, today announces a suite of AI agents that handle routine spend management autonomously, so finance leaders can focus on decisions rather than administrative tasks. Finance teams are under growing pressure: 45% of European companies say their current processes slow them down, and leaders describe approval workflows as so cumbersome they struggle to operate at the required speed. Meanwhile, 73% believe the...