

Newsroom
Sorted by: Latest
-
Shoko Co., Ltd.韩国工厂启动药用辅料“Viscomedi”的商业化生产
东京--(BUSINESS WIRE)--(美国商业资讯)-- 业务涵盖化工、塑料和金属陶瓷三大领域的综合性大宗商品贸易公司Shoko Co., Ltd.(总部:东京都港区;总裁兼首席执行官:Kentaro Watanabe;以下简称“Shoko”)欣然宣布,继2025年6月与Hannong Chemicals Inc.(韩国京畿道安养市;以下简称“Hannong Chemicals”)签署销售框架合作协议后,新型药用辅料“Viscomedi”的制造工厂已顺利竣工,并于2026年2月全面启动商业化生产。 Hannong Chemicals一直致力于开发用于制药领域的“部分中和聚丙烯酸酯”产品,并将其正式命名为“Viscomedi”。该公司持续推进该产品的研发,旨在为制药应用提供一种全新的选择。核心生产设施已于去年11月完工,随后进行了设备调试及各项法规合规工作。 截至2026年6月,Shoko与Hannong Chemicals正基于现有的销售框架协议,就最终协议进行最后阶段的谈判。协议达成后,Shoko计划担任“Viscomedi”的全球独家经销商。 有关本产品的咨询,请访问: ht...
-
Shoko Co., Ltd. Began Commercial Production of Pharmaceutical Excipient “Viscomedi” at Its South Korean Plant
TOKYO--(BUSINESS WIRE)--Shoko Co., Ltd. (Head Office: Minato-ku, Tokyo; President & CEO: Kentaro Watanabe; hereinafter “Shoko”), a comprehensive commodity trading firm engaged in three business domains—chemicals, plastics, and metal & ceramics—is pleased to announce that, following the sales framework agreement announced in June 2025 with Hannong Chemicals Inc. (Anyang, Gyeonggi-do, South Korea; hereinafter “Hannong Chemicals”), the manufacturing plant for the new pharmaceutical excipie...

-
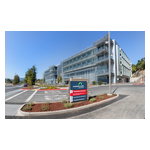
MarinHealth Launches the Haynes Heart & Vascular Institute, Marking a New Era in Cardiovascular Care for the North Bay
GREENBRAE, Calif.--(BUSINESS WIRE)--MarinHealth today announced the official launch of the Haynes Heart & Vascular Institute, recognizing the transformational generosity and enduring legacy of the late Bill Haynes and Reta Haynes, whose vision and philanthropy helped shape one of the North Bay's premier cardiovascular programs. The naming of the Institute celebrates the Haynes family's longstanding commitment to advancing heart care and reflects MarinHealth's continued investment in innovat...
-
Xylem gibt Ernennungen in der Segmentleitung bekannt
WASHINGTON--(BUSINESS WIRE)--Xylem Inc. (NYSE: XYL), ein weltweit führendes Unternehmen für Wasserlösungen, gab heute die Ernennung von zwei Führungskräften zum 1. Juli bekannt, die beide President und Chief Executive Officer Matthew Pine unterstehen. Meredith Emmerich wurde in das Amt des EVP und President, Measurement und Control Solutions, berufen. Zuletzt war sie als EVP und President, Applied Water, bei Xylem tätig. Emmerich wechselte 2024 zu Xylem von der Carrier Global Corporation (NYSE:...

-
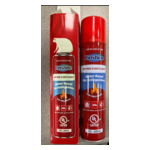
UL Solutions Warns of Unauthorized UL Marks on Water-Based Fire Extinguishers
NORTHBROOK, Ill.--(BUSINESS WIRE)--UL Solutions (NYSE: ULS), a global leader in applied safety science, issued a public notice regarding Zinshine Water Based Fire Extinguishers, which bear unauthorized UL Certification Marks for the United States and Canada and may pose safety risks. The affected products have not been evaluated by UL Solutions against the appropriate safety standards, and it is unknown whether they meet any safety requirements. UL Solutions recommends that these fire extinguis...
-
Align Technology Statement on European Commission Proceeding
TEMPE, Ariz.--(BUSINESS WIRE)--Align Technology, Inc. (“Align”) (Nasdaq: ALGN), a leading global medical device company that designs, manufactures, and sells the Invisalign® System of clear aligners, iTero™ intraoral scanners, and exocad™ CAD/CAM software for digital orthodontics and restorative dentistry, today responded to the European Commission’s June 30 press release announcing an investigation involving the Company based on a complaint made by an Align competitor. Align Technology is comm...

-
BeOne Medicines公布BRUKINSA用於一線套細胞淋巴瘤治療的第三期臨床試驗正面結果
加州聖卡洛斯--(BUSINESS WIRE)--(美國商業資訊)-- 全球性腫瘤公司BeOne Medicines Ltd. (Nasdaq: ONC; HKEX: 06160; SSE: 688235)今日公布了第三期MANGROVE研究(BGB-3111-306; NCT04002297)的正面初步主要結果。該研究評估了基礎性BTK抑制劑BRUKINSA® (zanubrutinib)聯合rituximab對比bendamustine聯合rituximab (BR)在既往未經治療的套細胞淋巴瘤(MCL)成人病患中的療效。MANGROVE是第一個在此類病患中評估以BTK抑制劑為基礎的無化療方案對比標準化療免疫療法的第三期全球性隨機試驗。這項關鍵的第三期試驗建立在BRUKINSA治療MCL的已有臨床證據基礎之上。 BeOne Medicines血液學醫學長Amit Agarwal, M.D.博士表示: 「對於新診斷的MCL病患,化療目前是默認選擇。MANGROVE首次證明,BRUKINSA聯合rituximab這一無化療方案,能夠帶來前所未見的無惡化存活期改善,可望在全球重新定義治療...
-
BeOne Medicines anuncia resultados positivos da Fase 3 para o BRUKINSA no tratamento de primeira linha do linfoma de células do manto
SAN CARLOS, Califórnia--(BUSINESS WIRE)--A BeOne Medicines Ltd. (Nasdaq: ONC; HKEX: 06160; SSE: 688235), uma empresa global de oncologia, anunciou hoje resultados preliminares positivos do estudo de Fase 3 MANGROVE (BGB-3111-306; NCT04002297), que avalia o inibidor de BTK de referência BRUKINSA®(zanubrutinibe) associado ao rituximabe em comparação com bendamustina associada ao rituximabe (BR) em pacientes adultos com linfoma de células do manto (LCM) não tratado anteriormente. O MANGROVE é o pr...
-
BeOne Medicines annonce des résultats positifs de phase III pour BRUKINSA dans le cadre du traitement de première intention du lymphome à cellules du manteau
SAN CARLOS, Calif.--(BUSINESS WIRE)--BeOne Medicines Ltd. (Nasdaq : ONC ; HKEX : 06160 ; SSE : 688235), une société internationale spécialisée en oncologie, a annoncé aujourd’hui les les résultats préliminaires positifs de l’étude de phase III MANGROVE (BGB-3111-306 ; NCT04002297) évaluant BRUKINSA® (zanubrutinib), un inhibiteur de BTK servant de traitement de base, associé au rituximab par rapport à la bendamustine associée au rituximab (BR) chez des patients adultes atteints d’un lymphome à c...
-
BeOne Medicines anuncia resultados positivos de fase 3 para BRUKINSA en el tratamiento de primera línea del linfoma de células del manto
SAN CARLOS, California--(BUSINESS WIRE)--BeOne Medicines Ltd. (Nasdaq: ONC; HKEX: 06160; SSE: 688235), empresa oncológica internacional, anunció hoy resultados preliminares positivos del estudio de fase 3 MANGROVE (BGB-3111-306; NCT04002297 ) que evalúa el inhibidor de la tirosina quinasa de Bruton como tratamiento base, BRUKINSA® (zanubrutinib), en combinación con rituximab, frente al tratamiento de bendamustina y rituximab en pacientes adultos con linfoma de células del manto (LCM) que no hab...