

Newsroom
Sorted by: Latest
-
The Open Group Releases OSDU® Data Platform Standard, Version 1.0
SAN FRANCISCO--(BUSINESS WIRE)--The Open Group, the global vendor‑neutral technology consortium, today announced the release of the OSDU® Data Platform Standard, Version 1.0. The new standard establishes a stable, clearly defined baseline for data platform capabilities, supporting greater interoperability, consistency, and confidence across the energy industry. The OSDU Data Platform Standard, Version 1.0 is designed to help organizations better manage, access, and use enterprise data by reduci...
-
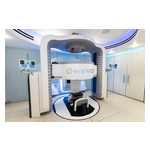
Marie® de Leo Cancer Care entre dans l'histoire à Stanford Medicine – Une première mondiale dans le domaine de la protonthérapie compacte en position verticale
LONDRES--(BUSINESS WIRE)--À la suite du premier traitement historique réalisé le 4 juin au Stanford Medicine Cancer Center Care, Leo Cancer Care annonce aujourd’hui que sa plateforme d’imagerie et de positionnement du patient en position verticale Marie® a permis de mener à bien le premier traitement par protonthérapie en position verticale réalisé sur un patient, à l’aide d’un système compact. Réalisé à l’aide du système de protonthérapie Mevion S250-FIT™ et optimisé par RayStation de RaySearc...

-
Resumen: Marie® by Leo Cancer Care hace historia en Stanford Medicine: una primicia internacional en terapia de protones compacta en posición vertical
LONDRES--(BUSINESS WIRE)--Tras el histórico primer tratamiento realizado el 4 de junio en el Stanford Medicine Cancer Center Care, Leo Cancer Care anuncia hoy el papel que ha desempeñado su plataforma de posicionamiento e imagen del paciente en posición vertical Marie® para hacer posible el primer tratamiento con terapia de protones en posición vertical y de tamaño compacto del mundo. Este logro, llevado a cabo con el sistema de terapia de protones Mevion S250-FIT™ y con la tecnología RayStatio...

-
Marie® von Leo Cancer Care schreibt Geschichte am Stanford Medicine – Weltneuheit bei der kompakten Protonentherapie in aufrechter Position
LONDON--(BUSINESS WIRE)--Nach der bahnbrechenden ersten Behandlung am Stanford Medicine Cancer Center am 4. Juni gibt Leo Cancer Care heute bekannt, dass seine Marie®-Plattform für die aufrechte Patientenpositionierung und Bildgebung die weltweit erste Behandlung eines Patienten mit der kompakten aufrechten Protonentherapie ermöglicht hat. Durchgeführt mit dem Mevion S250-FIT™ Protonentherapiesystem und gestützt auf RayStation von RaySearch, ist dieser Meilenstein der Höhepunkt einer zehnjährig...

-
Riassunto: Marie® di Leo Cancer Care entra nella storia di Stanford Medicine: prima al mondo nella protonterapia in posizione eretta e compatta
LONDRA--(BUSINESS WIRE)--Dopo lo storico primo trattamento allo Stanford Medicine Cancer Center Care il 4 giugno, Leo Cancer Care oggi annuncia il ruolo che ha avuto la sua piattaforma Marie® di posizionamento eretto e di imaging del paziente nel consentire il primo trattamento al mondo di un paziente con protonterapia in posizione eretta compatta. Realizzato tramite il Sistema di protonterapia Mevion S250-FIT™ e alimentato da RayStation di RaySearch, lo storico evento terapeutico è il culmine...
-
Samenvatting: Marie® van Leo Cancer Care schrijft geschiedenis aan Stanford Medicine — een wereldprimeur in compacte rechtopstaande protonentherapie
LONDEN--(BUSINESS WIRE)--Na de opmerkelijke eerste behandeling aan Stanford Medicine Cancer Center Care op 4 juni, maakte Leo Cancer Care vandaag de rol bekend van zijn Marie® platform voor rechtopstaande patiëntpositionering en beeldvorming om de eerste patiëntbehandeling ter wereld met compacte rechtopstaande protonentherapie mogelijk te maken. Deze mijlpaal, verwezenlijkt met gebruik van het Mevion S250-FIT™ Proton Therapy System en aangestuurd door RayStation van RaySearch, is de bekroning...

-
Argonne and the Department of Energy Launch New Partnership to Speed up U.S. Manufacturing Innovation
LEMONT, Ill.--(BUSINESS WIRE)--National Science-at-Scale Collaborative will connect industry, Department of Energy and national laboratories to accelerate manufacturing innovation...
-
Xsolla brengt expertise in direct-to-consumer commerce naar Gamesforum Hamburg 2026 met keynote en paneldiscussies
LOS ANGELES--(BUSINESS WIRE)--Xsolla, een wereldwijde leider in videogamehandel, heeft vandaag zijn deelname aan Gamesforum Hamburg 2026 aangekondigd. Het evenement vindt plaats op 9 en 10 juni 2026 in het NORD EVENT Panoramadeck in Hamburg, Duitsland. Als exclusieve wereldwijde partner van de Gamesforum-serie brengt Xsolla zijn expertise in direct-to-consumer commerce naar een van de toonaangevende bijeenkomsten van Europa voor de groei en monetisatie van mobiele games. Jane Startseva, Vice Pr...

-
Xsolla lleva su experiencia en comercio directo al consumidor al Gamesforum Hamburg 2026 con una ponencia principal y participa en las mesas redondas
LOS ÁNGELES--(BUSINESS WIRE)--Xsolla, líder mundial en comercio de videojuegos, ha anunciado hoy que participará en el Gamesforum Hamburg 2026, que se realizará del 9 al 10 de junio de 2026 en el NORD EVENT Panoramadeck de Hamburgo, Alemania. En calidad de socio global exclusivo de la serie Gamesforum, Xsolla llevará toda su experiencia en comercio directo al consumidor a uno de los principales encuentros europeos sobre el crecimiento y la monetización de los juegos para móviles, con Jane Start...

-
Xsolla ist auf dem Gamesforum Hamburg 2026 mit Keynote und Teilnahme am Panel vertreten und bringt Fachwissen zum Direct-to-Consumer Commerce ein
LOS ANGELES--(BUSINESS WIRE)--Xsolla, ein weltweit führender Anbieter im Bereich Videospiel-E-Commerce, gab heute seine Teilnahme am Gamesforum Hamburg 2026 bekannt, das vom 9. bis 10. Juni 2026 im NORD EVENT Panoramadeck in Hamburg stattfindet. Als exklusiver globaler Partner der Gamesforum-Reihe wird Xsolla mit seinem Know-how im Bereich Direct-to-Consumer-Commerce auf einer der führenden europäischen Veranstaltungen für das Wachstum und die Monetarisierung von Handyspielen zum Gelingen beitr...
