

Newsroom
Sorted by: Latest
-
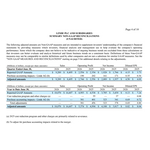
Linde Reports Second-Quarter 2026 Results
WOKING, England--(BUSINESS WIRE)--Linde plc (Nasdaq: LIN) today reported second-quarter 2026 net income of $1,928 million and diluted earnings per share of $4.15, up 9% and up 11%, respectively. Excluding Linde AG purchase accounting impacts, adjusted net income was $2,089 million, up 8% versus prior year. Adjusted diluted earnings per share was $4.50, 10% above prior year. Linde’s sales for the second quarter were $9,289 million, up 9% versus prior year including 2% favorable currency impact....
-
First Trust Global Funds PLC UK Regulatory Announcement: Net Asset Value(s)
LONDON--(BUSINESS WIRE)-- Funds Date TIDM ISIN Code Shares in Issue Currency Net Asset Value NAV/per Share First Trust IPOX Europe Equity Opportunities UCITS ETF 30.07.2026 IPXE.IM IE00BFD26097 50,002.00 EUR 1,235,263.30 24.704 ...
-
First Trust Global Funds PLC UK Regulatory Announcement: Net Asset Value(s)
LONDON--(BUSINESS WIRE)-- Funds Date TIDM ISIN Code Shares in Issue Currency Net Asset Value NAV/per Share First Trust Cloud Computing UCITS ETF 30.07.2026 CPQ IE00BFD2H405 6,400,002.00 USD 376,672,462.52 58.855 ...
-
First Trust Global Funds PLC UK Regulatory Announcement: Net Asset Value(s)
LONDON--(BUSINESS WIRE)-- Funds Date TIDM ISIN Code Shares in Issue Currency Net Asset Value NAV/per Share First Trust Dow Jones Internet UCITS ETF 30.07.2026 FDNU IE00BG0SSC32 1,150,002.00 USD 42,523,129.69 36.977 ...
-
First Trust Global Funds PLC UK Regulatory Announcement: Net Asset Value(s)
LONDON--(BUSINESS WIRE)-- Funds Date TIDM ISIN Code Shares in Issue Currency Net Asset Value NAV/per Share First Trust Nasdaq Cybersecurity UCITS ETF 30.07.2026 NQCYBREN IE00BF16M727 26,798,015.00 USD 1,496,617,986.90 55.848 ...
-
First Trust Global Funds PLC UK Regulatory Announcement: Net Asset Value(s)
LONDON--(BUSINESS WIRE)-- Funds Date TIDM ISIN Code Shares in Issue Currency Net Asset Value NAV/per Share First Trust NYSE Arca Biotechnology UCITS ETF 30.07.2026 FBTU.LN IE00BL0L0H60 450,002.00 USD 13,915,342.81 30.923 ...
-
Linde to Invest $1 Billion to Support Major U.S. Semiconductor Facility Expansion
WOKING, England--(BUSINESS WIRE)--Linde (Nasdaq: LIN) today announced that it has been awarded a new long-term agreement to supply ultra-high-purity industrial gases to one of the world’s largest semiconductor manufacturers. The agreement will support the expansion of the customer’s semiconductor manufacturing complex in Phoenix, Arizona. Linde will invest $1 billion to expand its existing on-site industrial gases complex in Phoenix, making the site one of Linde’s largest investments for an ele...
-
Orano Med Provides Half-Year Progress Report and Business Outlook
VILLEJUIF, France--(BUSINESS WIRE)--Orano Med provides an overview of activities and progress made during the first half, along with a business outlook for the remainder of 2026....

-
Samson Rock Capital LLP UK Regulatory Announcement: Form 8.3
LONDON--(BUSINESS WIRE)-- FORM 8.3 PUBLIC OPENING POSITION DISCLOSURE/DEALING DISCLOSURE BY A PERSON WITH INTERESTS IN RELEVANT SECURITIES REPRESENTING 1% OR MORE Rule 8.3 of the Takeover Code (the “Code”) 1. KEY INFORMATION (a) Full name of discloser: SAMSON ROCK CAPITAL LLP (b) Owner or controller of interests and short positions disclosed, if different from 1(a): The naming of nominee or vehicle companies is insufficient. For a trust, the trustee(s), settlor and beneficiaries must be named....