

Newsroom
Sorted by: Latest
-
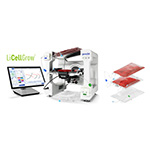
PHCbi、In-Lineモニタリング技術を搭載した自動培養装置「LiCellGrowTM」を発売
東京--(BUSINESS WIRE)--(ビジネスワイヤ) -- PHCホールディングス株式会社 (本社:東京都千代田区)傘下のPHC株式会社 バイオメディカ事業部(本社:東京都千代田区、代表取締役社長:中村 伸朗、以下「PHCbi」)は、本日、細胞の連続的な代謝変化をリアルタイムに可視化し、測定結果に基づき自動で培養制御を行う自動培養装置「LiCellGrowTM(リセルグロー)(*1)」を発売しましたので、お知らせいたします。なお、本装置は、2026年3月19日(木)から3月20日(金)まで神戸国際会議場および神戸国際展示場で開催される「第25回日本再生医療学会総会」に出展いたします。 細胞遺伝子治療(CGT)は、遺伝性疾患やがんなど、難治性疾患の治療手段として期待され、研究開発が急速に進展しています。しかし、細胞医薬品の製造現場では、患者さんごとに異なる細胞特性や製造工程の影響により、品質の均一化が難しく、製造効率や歩留まりの低下、製造コストの増大といった課題が存在しています。これらの課題を解決するためには、製造工程における品質評価の重要なパラメーターと品質特性を特定し、製造...
-
PHCbi Launches LiCellGrow™ Cell Expansion System to Support High-Quality and Efficient Production of Cell and Gene Therapies
TOKYO--(BUSINESS WIRE)--PHC Corporation’s Biomedical Division (Head Office: Chiyoda-ku, Tokyo; President: Nobuaki Nakamura; hereinafter “PHCbi”), a global provider of laboratory sample storage and cell cultivation solutions and subsidiary of PHC Holdings Corporation (Head Office: Chiyoda-ku, Tokyo), today announced the launch of its new cell expansion system LiCellGrow™ (*1) for research use in Japan and other select countries worldwide(*2). The system is designed to improve quality and efficie...

-
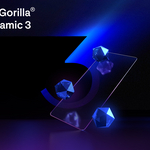
Corning Launches Corning® Gorilla® Glass Ceramic 3 with Enhanced Drop Durability
CORNING, N.Y.--(BUSINESS WIRE)--Corning Incorporated (NYSE: GLW) today announced the launch of Corning® Gorilla® Glass Ceramic 3, the toughest Gorilla Glass Ceramic ever made. Designed to help deliver enhanced durability across a device’s lifetime, Gorilla Glass Ceramic 3 will be featured on Motorola’s upcoming razr fold device. “We engineer our materials with longevity in mind, not just initial performance,” said Lori Hamilton, Division Vice President & Business Technology Director, Cornin...
-
Corning lance Corning® Gorilla® Glass Ceramic 3 avec une résistance aux chutes améliorée
CORNING, New York--(BUSINESS WIRE)--Corning Incorporated (NYSE : GLW) a annoncé aujourd’hui le lancement de Corning® Gorilla® Glass Ceramic 3, le Gorilla Glass Ceramic le plus résistant jamais fabriqué. Conçu pour offrir une durabilité accrue tout au long de la durée de vie d’un appareil, Gorilla Glass Ceramic 3 sera utilisé sur le prochain appareil pliable razr de Motorola. « Nous concevons nos matériaux en tenant compte de leur longévité, et pas seulement de leurs performances initiales », dé...

-
Samenvatting: Corning lanceert Corning® Gorilla® Glass Ceramic 3 met verbeterde valbestendigheid
CORNING, N.Y.--(BUSINESS WIRE)--Corning Incorporated (NYSE: GLW) heeft vandaag de lancering aangekondigd van Corning® Gorilla® Glass Ceramic 3, het sterkste Gorilla Glass Ceramic dat ooit is gemaakt. Gorilla Glass Ceramic 3 is ontworpen om de duurzaamheid van een apparaat gedurende de hele levensduur te verbeteren en zal worden gebruikt in Motorola's razr fold-apparaat dat binnenkort wordt op de markt komt. “We ontwikkelen onze materialen met het oog op een lange levensduur, niet alleen op basi...

-
Riassunto: Corning lancia Corning® Gorilla® Glass Ceramic 3 che offre durabilità superiore grazie alla resistenza alle cadute potenziata
CORNING, New York--(BUSINESS WIRE)--Corning Incorporated (NYSE: GLW) ha annunciato oggi il lancio di Corning® Gorilla® Glass Ceramic 3, la vetroceramica Gorilla Glass più resistente mai realizzata. Progettata per contribuire a offrire una resistenza maggiore alle cadute per l’intero ciclo di vita di un dispositivo, Gorilla Glass Ceramic 3 sarà utilizzato sul prossimo dispositivo pieghevole razr Motorola. “Progettiamo i nostri materiali mirando a ottenere una lunga durata, non pensando solo alle...

-
Corning bringt Corning® Gorilla® Glass Ceramic 3 mit verbesserter Sturzfestigkeit auf den Markt
CORNING, New York--(BUSINESS WIRE)--Corning Incorporated (NYSE: GLW) hat heute die Markteinführung von Corning® Gorilla® Glass Ceramic 3 angekündigt, dem bisher widerstandsfähigsten Gorilla Glass Ceramic-Materials des Unternehmens. Gorilla Glass Ceramic 3 wurde entwickelt, um die Widerstandsfähigkeit eines Geräts über seine gesamte Lebensdauer hinweg zu verbessern und kommt in Motorolas neuem Razr Fold-Gerät zum Einsatz. „Wir entwickeln unsere Materialien mit Blick auf Langlebigkeit, nicht nur...

-
Resumen: Corning lanza Corning® Gorilla® Glass Ceramic 3 con mayor durabilidad contra caídas
CORNING, NUEVA YORK--(BUSINESS WIRE)--Corning Incorporated (NYSE: GLW) anunció hoy el lanzamiento de Corning® Gorilla® Glass Ceramic 3, el Gorilla Glass Ceramic más resistente fabricado en la historia. Diseñado para ayudar a brindar más durabilidad en toda la vida útil de un dispositivo, Gorilla Glass Ceramic 3 se incluirá en el próximo dispositivo plegable razr de Motorola. “Diseñamos nuestros materiales pensando en su longevidad, no solo en su rendimiento inicial”, indicó Lori Hamilton, vicep...

-
State of the Call 2026: AI Deepfake Voice Calls Hit 1 in 4 Americans as Consumers Say Scammers Are Beating Mobile Network Operators 2-to-1
SEATTLE--(BUSINESS WIRE)--Hiya, the global leader in trusted voice solutions that protects more than 550 million users monthly, today released its State of the Call 2026 report, revealing that the weaponization of AI has pushed consumer frustration with their wireless providers to a tipping point. Based on a survey of over 12,000 consumers across the US, UK, Canada, France, Germany, and Spain, the data show that the rise of deepfakes isn't just a nuisance, it is driving demands for strict regul...

-
Aptiv and Wind River Showcase Network V2X Solution for Sensor Sharing Leveraging Verizon’s Connected Driving Platform
BARCELONA, Spain--(BUSINESS WIRE)--Aptiv PLC (NYSE: APTV) and Wind River, an Aptiv company and global leader in software for the intelligent edge, is unveiling a proof-of-concept showcasing a mobile-network Vehicle-to-Everything (V2X) solution for sharing of sensor data between vehicles to support advanced safety and automation features leveraging the Verizon Business connected-driving platform Edge Transportation Exchange. Showcasing at MWC Barcelona, the demonstration highlights how vehicles...