

Newsroom
Sorted by: Latest
-
Merrithew® 、GYROTONIC® Organizationの買収により、マインドフル・ムーブメント分野での世界的リーダーシップを拡大
トロント--(BUSINESS WIRE)--(ビジネスワイヤ) -- マインドフル・ムーブメントの教育・器具分野における世界的リーダーであり、STOTT PILATES®、ZEN•GA®、Halo® Training、Total Barre® などの国際的に認められたプログラムを開発したMerrithew® は、世界的に評価の高いGYROTONIC®メソッドとGYROKINESIS®メソッドを生み出したGYROTONIC®Organizationを買収したことを発表しました。 ジュリウ・ホバス(Juliu Horvath)氏が創始したGYROTONIC®メソッドとGYROKINESIS®メソッドは、専用器具と一連の動作を通じて、流れるような動き、筋力、可動性、協調性、リハビリテーションを組み合わせる独自のムーブメント・アプローチにより、国際的に認められています。世界各地のスタジオやウェルネス・センターで実践されているこれらのメソッドは、インストラクター、トレーナー、セラピスト、ムーブメント分野の専門家からなる、熱心で結束の強い世界的コミュニティを育んできました。 この買収は、Mer...
-
Riassunto: Merrithew® amplia la leadership mondiale del movimento mindful con l'acquisizione dell'organizzazione GYROTONIC®
TORONTO--(BUSINESS WIRE)--Merrithew®, un leader globale nell'educazione al movimento e nell'attrezzatura mindful e creatore di programmi di fama internazionale come STOTT PILATES®, ZEN•GA®, Halo® Training e Total Barre®, oggi ha annunciato l'acquisizione dell'organizzazione GYROTONIC®, creatrice dei metodi GYROTONIC® e GYROKINESIS®, celebrati a livello mondiale. Messi a punto da Juliu Horvath, i metodi GYROTONIC® e GYROKINESIS® sono riconosciuti a livello internazionale per il particolare appro...

-
Samenvatting: Merrithew® breidt zijn leidende positie in de wereldwijde mindful-beweging uit met de overname van de GYROTONIC® -organisatie
TORONTO--(BUSINESS WIRE)--Merrithew®, wereldwijd koploper op het gebied van mindful bewegingsonderwijs en -apparatuur en bedenker van internationaal erkende programma’s zoals STOTT PILATES®, ZEN•GA®, Halo® Training en Total Barre®, maakt vandaag bekend dat het de GYROTONIC®-organisatie heeft overgenomen. Deze organisatie is de uitvinder van de wereldwijd gerespecteerde GYROTONIC®- en GYROKINESIS®-methoden. De door Juliu Horvath ontwikkelde methoden GYROTONIC® en GYROKINESIS® staan internationaa...

-
A Merrithew® expande a liderança global do movimento de atenção plena com a aquisição da GYROTONIC® Organization
TORONTO--(BUSINESS WIRE)--Merrithew®, líder global em educação e equipamentos para movimento consciente e criadora de programas reconhecidos internacionalmente, incluindo STOTT PILATES®, ZEN•GA®, Halo® Training e Total Barre®, anunciam hoje a aquisição da GYROTONIC® Organization, criadora dos métodos mundialmente reconhecidos: GYROTONIC® e GYROKINESIS®. Fundados por Juliu Horvath, os métodos GYROTONIC® e GYROKINESIS® são reconhecidos internacionalmente por sua abordagem singular ao movimento, c...

-
Merrithew® amplía su liderazgo en el movimiento consciente global con la adquisición de GYROTONIC®
TORONTO--(BUSINESS WIRE)--Merrithew®, líder mundial en educación y equipamiento para el movimiento consciente y creador de programas reconocidos internacionalmente, como STOTT PILATES®, ZEN•GA®, Halo® Training y Total Barre®, anunció hoy la adquisición de la organización GYROTONIC®, creador de los mundialmente respetados métodos GYROTONIC® y GYROKINESIS®. Fundados por Juliu Horvath, los métodos GYROTONIC® y GYROKINESIS® son reconocidos internacionalmente por su enfoque distintivo del movimiento...

-
Merrithew® renforce sa position de leader mondial dans le domaine du mouvement conscient grâce à l’acquisition de l’organisation GYROTONIC®
TORONTO--(BUSINESS WIRE)--Merrithew®, un leader mondial dans le domaine de l’enseignement du mouvement conscient (« mindful movement ») et des équipements connexes, et à l’origine de programmes reconnus à l’échelle internationale (STOTT PILATES®, ZEN•GA®, Halo® Training et Total Barre®), a annoncé aujourd’hui l’acquisition de l’organisation GYROTONIC®, créatrice des méthodes mondialement reconnues GYROTONIC® et GYROKINESIS®. Développées par Juliu Horvath, les méthodes GYROTONIC® et GYROKINESIS®...

-
Belden Announces Pricing of $1.85 Billion Senior Secured Term Loan B Facility
ST. LOUIS--(BUSINESS WIRE)--Belden Inc. (NYSE: BDC) (“Belden” or the “Company”), a leading global supplier of specialty networking solutions, announced today that it has successfully syndicated and priced a new $1.85 billion aggregate principal amount senior secured term loan B due 2033 (the "Facility").The loans under the Facility will be issued at a price equal to 99.75% of their face value (or with an original issue discount of 0.25%) and bear interest at SOFR plus 2.25%, with closing expect...
-
In its 25th Year, Giftcards.com Attracts 28 Million Annual Visitors and Nearly 500 Brand Partners
PLEASANTON, Calif.--(BUSINESS WIRE)--Giftcards.com marks 25 years with $2B+ in gift card sales, 28M annual visitors and nearly 500 brand partners....
-
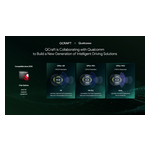
QCraft在Qualcomm最新Snapdragon Ride SoC上展示城市NOA,目標於2026年實現全球量產
中國無錫--(BUSINESS WIRE)--(美國商業資訊)-- 在2026年Qualcomm汽車技術與合作峰會上,QCraft與Qualcomm讓與會者有機會在配備SA8650P的量產車型中,親身體驗QCraft的城市NOA解決方案,這標誌著向2026年全球量產邁出了關鍵一步。 該峰會於6月5日舉行,是自QCraft與Qualcomm於2025年9 月建立戰略合作夥伴關係以來的最新里程碑。在不到一年的時間裡,QCraft已在Qualcomm的SA8775P和SA8650P平台上完成了高速公路與城市NOA的開發及道路驗證,並計劃於2026年進行全球交付。目前,雙方正共同開發基於Qualcomm QAM8797P平台、具備更高算力的解決方案。 在峰會期間的城市實地測試搭乘中,搭載SA8650P的車輛處理了無保護左轉、人車混流路況、隧道、主副道切換以及擁堵路段的操控,展現出平穩且如同人類駕駛般的控制能力。QCraft技術長Dong Li博士發表了主題為「從自動駕駛到通用型物理人工智慧」的演講,他表示:「QCraft在Snapdragon Ride™平台上的開發已進入量產的快車道。」 大規...
-
SynergenX, Low T Center and HerKare Clinics Unite Under the SynergenX Brand
HOUSTON--(BUSINESS WIRE)--SynergenX announced today that its Low T Center and HerKare clinics will begin transitioning under one unified brand identity over the coming year, reflecting the organization’s continued commitment to helping patients live healthier, more confident, and more fulfilling lives. Though the company will be unveiling an exciting new logo and updated marketing materials, this transition represents more than a visual evolution. It reflects a broader philosophy of care center...