

Newsroom
Sorted by: Latest
-
Leostream Platform Update Offers Sophisticated Identity and Access Management, Infrastructure Flexibility, Intelligent Automation
BOSTON--(BUSINESS WIRE)--Leostream Corporation today announced 2026’s first major update to the industry-leading Leostream® Remote Desktop Access Platform, offering stronger identity-driven access, broader infrastructure flexibility, and deeper automation.Leostream’s new 26.1 platform delivers a secure, high-performance, vendor-agnostic digital desktop/workstation solution for hybrid, GPU-enabled, and specialized enterprise environments. New features add modern authentication, more secure DCV ac...
-
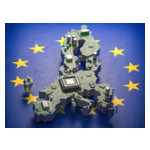
Gradiant Supports Landmark Semiconductor Manufacturing Expansion in Dresden
BOSTON--(BUSINESS WIRE)--Gradiant, a global leader in advanced water and wastewater solutions, today announced the successful completion of its work for a major new semiconductor manufacturing facility in Dresden, strengthening Europe’s capacity to produce the technologies powering an increasingly digital and electrified world. Representing an investment of approximately €5 billion, the new facility is one of Germany’s largest industrial projects and a significant expansion within Silicon Saxon...
-
First Trust Global Funds PLC UK Regulatory Announcement: Net Asset Value(s)
LONDON--(BUSINESS WIRE)-- Funds Date TIDM ISIN Code Shares in Issue Currency Net Asset Value NAV/per Share First Trust US Equity Income UCITS ETF 20.07.2026 UNCU.LN IE00BD6GCF16 869,652.00 USD 42,755,862.93 49.164 ...
-
First Trust Global Funds PLC UK Regulatory Announcement: Net Asset Value(s)
LONDON--(BUSINESS WIRE)-- Funds Date TIDM ISIN Code Shares in Issue Currency Net Asset Value NAV/per Share First Trust Growth Strength UCITS ETF 20.07.2026 FTGS.LN IE000YZLMXT9 25,002.00 USD 586,198.24 23.446 ...
-
La Chambre de commerce d'Hollywood s’invite dans l'hôtellerie de luxe
HOLLYWOOD, Californie, États-Unis--(BUSINESS WIRE)--Marquant une nouvelle ère dans son expansion internationale, la Chambre de commerce d'Hollywood, l'entité à l’origine du légendaire Hollywood Walk of Fame® et du panneau® historique d’Hollywood, a aujourd’hui annoncé son entrée dans l’univers de l’hospitalité de luxe grâce à un partenariat stratégique avec The Scene Hotels & Resorts pour lancer la marque Hollywood Hotels & Residences. Forte de plus de 40 ans d'expérience dans les secte...
-
غرفة تجارة هوليوود توسّع أعمالها وتدخل قطاع الضيافة الفاخرة
هوليوود، كاليفورنيا، الولايات المتحدة الأمريكية--(BUSINESS WIRE)--في خطوة تمثّل فصلاً جديداً في مسيرة توسّعها، أعلنت غرفة تجارة هوليوود، وهي الجهة التي تقف وراء ممشى مشاهير هوليوود (Hollywood Walk of Fame®) الأسطوري ولافتة هوليوود (Hollywood Sign®) التاريخية، اثنين من أبرز المعالم الثقافية وأكثرها شهرة على مستوى العالم، عن دخولها إلى قطاع الضيافة الفاخرة من خلال شراكة استراتيجية مع The Scene Hotels & Resorts لإطلاق علامة Hollywood Hotels & Residences التجارية.يتناول هذا البيان الصحفي الو...
-
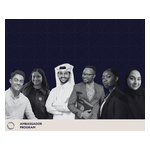
Een generatie vormen door dialoog: een kijkje in het Doha Debates Ambassador Program
DOHA, Qatar--(BUSINESS WIRE)--In een wereld die wordt gevormd door verandering en tegenstrijdige verhalen, is het belangrijker dan ooit om te kunnen luisteren, vragen te stellen en een constructieve dialoog aan te gaan. Via het Doha Debates Ambassador Program, een productie van de Qatar Foundation, leren jongeren van over de hele wereld niet alleen deze vaardigheden, maar passen ze deze ook actief toe in hun eigen omgeving, carrière en studie. Dit online educatieve programma leert jongeren van...

-
Plasmare una generazione attraverso il dialogo: uno sguardo all'Ambassador Program di Doha Debates
DOHA, Qatar--(BUSINESS WIRE)--In un mondo caratterizzato dal cambiamento e da narrazioni contrastanti, la capacità di ascoltare, porre domande e impegnarsi in un dialogo costruttivo non è mai stata così fondamentale. Attraverso l'Ambassador Program dei Doha Debates, un'iniziativa della Qatar Foundation, i giovani di tutto il mondo non solo acquisiscono queste competenze, ma le applicano attivamente nelle loro comunità, nel loro percorso professionale e nei loro ambiti di studio. Questo programm...
-
Gritt Launches with $32.4M to Build Physical AI for Accelerating the World's Infrastructure Buildout
SAN FRANCISCO--(BUSINESS WIRE)--Gritt, the company building an intelligent system combining robotics and AI to accelerate the world’s infrastructure buildout, launched today with $32.4M in pre-seed and Series A funding. The $26M Series A was led by Obvious Ventures, with participation from Union Square Ventures and Active Impact Investments, and support from previous investors First Round Capital, Climactic, Congruent Ventures, and VSC Ventures. Gritt’s robotic arms and AI connect to existing j...
-
Lumen Recognized in Gartner® Report, AI Vendor Race: Lumen Is the Company to Beat in Enterprise WAN and Connectivity Services for AI
DENVER--(BUSINESS WIRE)--Gartner® recognized Lumen Technologies (NYSE: LUMN) in its June 25, 2026, report, AI Vendor Race: Lumen Is the Company to Beat in Enterprise WAN and Connectivity Services for AI. The report states by combining Lumen’s fiber footprint, dense metro infrastructure and edge capabilities with Alkira’s cloud-native control plane, the company strengthens its ability to extend its leadership into enterprise AI WAN and connectivity services. “AI is changing how businesses operat...