Newsroom
Sorted by: Latest
-
RFG Advisory Surpasses $1.5 Billion in Recruited Client Assets During Record First Half of 2026
BIRMINGHAM, Ala.--(BUSINESS WIRE)--RFG Advisory ("RFG"), an innovator in the wealth management industry dedicated to helping independent financial Advisors build their businesses without compromise, today announced it has surpassed $1.5 billion in recruited client assets during the first half of 2026, marking the strongest recruiting period in firm history.The milestone was reached with the addition of Brian LaHue, CFP® and Sweet Life Financial Planning (“Sweet Life”), an Indiana-based advisory...
-
StarSpark AI Reinvents Personalized Learning With Integrated Lectures, Practice and Feedback
PLEASANTON, Calif.--(BUSINESS WIRE)--StarSpark announces the launch of its connected, adaptive learning system to make high-quality, personalized learning easier for all users....
-
Maxio Launches Native Entitlements, Making Access Part of the Subscription Record for B2B SaaS and AI
ATLANTA--(BUSINESS WIRE)--Maxio, the leading platform for billing automation and revenue management, announced the release of Entitlements....
-
First Trust Global Funds PLC UK Regulatory Announcement: Net Asset Value(s)
LONDON--(BUSINESS WIRE)-- Funds Date TIDM ISIN Code Shares in Issue Currency Net Asset Value NAV/per Share First Trust US Momentum UCITS ETF 20.07.2026 FTMO.LN IE000CY30YV9 3,100,002.00 USD 92,814,824.11 29.940 ...
-
Sabra Issues Business Update and Increases Full-Year 2026 Guidance
TUSTIN, Calif.--(BUSINESS WIRE)--Sabra Health Care REIT, Inc. (“Sabra,” the “Company” or “we”) (Nasdaq: SBRA) today announced a business update detailed below. Portfolio Update Sabra has entered into letters of intent to re-tenant all of its 26 properties leased to Avamere (“Avamere”). Under the proposed transition, 22 properties would be transitioned to subsidiaries of Cascadia Healthcare (“Cascadia”), a leading diversified healthcare operator concentrated in the Pacific Northwest with approxi...
-
Thryv to Release Second Quarter 2026 Financial Results on Tuesday, August 4
DALLAS--(BUSINESS WIRE)--Thryv (Nasdaq: THRY) to release its second quarter 2026 financial results on Tuesday, August 4....
-
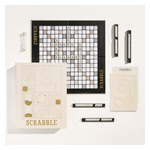
WS Game Company Launches New Studio Collection at Target
MANCHESTER-BY-THE-SEA, Mass.--(BUSINESS WIRE)--WS Game Company, a premium board game manufacturer with an authorized Hasbro license, today released its third collection at Target, the Studio Collection. SCRABBLE Studio Edition serves as the first game in the lineup and is now available at Target stores and online at Target.com. "With this new line, we sought to provide a larger form factor and reimagined take on our best-selling Vintage Bookshelf Collection," said Kerry Addis, co-owner and COO,...
-
First Trust Global Funds PLC UK Regulatory Announcement: Net Asset Value(s)
LONDON--(BUSINESS WIRE)-- Funds Date TIDM ISIN Code Shares in Issue Currency Net Asset Value NAV/per Share First Trust NASDAQ Clean Edge Green Energy UCITS ETF 20.07.2026 QCLN.LN IE00BDBRT036 2,425,002.00 USD 47,861,925.96 19.737 ...
-
Qube Research & Technologies LTD UK Regulatory Announcement: Form 8.3
LONDON--(BUSINESS WIRE)-- Ap27 FORM 8.3 IRISH TAKEOVER PANEL OPENING POSITION DISCLOSURE/DEALING DISCLOSURE UNDER RULE 8.3 OF THE IRISH TAKEOVER PANEL ACT, 1997, TAKEOVER RULES, 2022 BY PERSONS WITH INTERESTS IN RELEVANT SECURITIES REPRESENTING 1% OR MORE 1. KEY INFORMATION (a) Full name of discloser Qube Research & Technologies Limited (b) Owner or controller of interests and short positions disclosed, if different from 1(a) The naming of nominee or vehicle companies is insufficient. For...
-
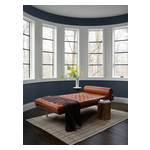
Benjamin Moore Celebrates 50 Years of the Historical Colour Collection: A Testament to Enduring Design
MONTVALE, N.J.--(BUSINESS WIRE)--Benjamin Moore, a trusted name in premium paint, colour innovation and coatings for more than 140 years, celebrates the 50th anniversary of its iconic Historical Colour Collection – a curated palette of 191 enduring hues inspired by 18th and 19th century North American architecture. With classic appeal and lasting quality, the nuanced neutrals, midtones and deep, rich shades continue to inspire and bring to life the transformative power of our paint and colour f...