Newsroom
Sorted by: Latest
-
PhoreMost Announces Lead Oncology Programme and Appoints Chief Medical Officer to Support Clinical Entry
CAMBRIDGE, England--(BUSINESS WIRE)--PhoreMost Limited (“PhoreMost”), a biotech company focused on turning scientific breakthroughs into life-changing cancer drugs, today announced its lead programme, PMC-001, a next-generation, small molecule microtubule targeting agent (MTA) for primary and secondary brain cancers. The milestone marks the Company’s progress towards first-in-human clinical trials, with a pipeline of differentiated and first-in-class assets in oncology. PMC-001 is a highly diff...
-
Cosylab and Heron Neutron Medical Corp. Sign Letter of Intent to Advance Global Deployment of Accelerator-Based BNCT Systems
LJUBLJANA, Slovenia--(BUSINESS WIRE)--Cosylab and Heron Neutron Medical Corp. announced today, 10 June 2026, the signing of a Letter of Intent to establish a strategic framework for joint market development to support the global deployment of Accelerator-Based Boron Neutron Capture Therapy (AB-BNCT) systems. The collaboration aims to accelerate the development and integration of sophisticated software solutions for use with AB-BNCT while strengthening AB-BNCT's international market access and b...
-
Laverock Therapeutics Reports Key Oncology Research Milestones
LONDON--(BUSINESS WIRE)--Laverock Therapeutics (‘Laverock’), a biotechnology company developing disease-responsive advanced therapies through its unique, programmable gene control technology, today announced key in-vivo functional milestones across its T-cell and macrophage oncology programmes for solid tumour indications. The data support lead programme selection and progression towards the clinic. Laverock’s platform technology enables programmable, tunable and multiplex gene control for both...
-
GlobalFoundries en Qualinx demonstreren Europa's eerste soevereine productieketen voor beveiligingskritische halfgeleiders
DRESDEN, Duitsland & DELFT, Nederland--(BUSINESS WIRE)--GlobalFoundries and Qualinx Demonstrate First European Sovereign Manufacturing Flow for Security‑Critical Semiconductors...
-
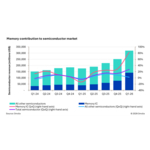
Omdia: Semiconductor Market Surpasses $300bn Quarterly Revenue in 1Q26 as Memory Market Shifts Historical Patterns
LONDON--(BUSINESS WIRE)--Following a record-setting year for the semiconductor industry, the start of the new year has continued the momentum, as semiconductor revenue grew 27% in 1Q26 from 4Q25 to reach $319bn, according to new research form Omdia. Memory revenue drove the increase, rising over 80% sequentially in 1Q26 from 4Q25. Since Omdia began tracking the semiconductor market at a quarterly level in1Q02, this 27% quarter-over-quarter (QoQ) growth is the highest observed. The market has no...
-
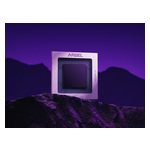
NextSilicon to Productize Arbel RISC-V Core Into 64-Core Enterprise Processor for AI and HPC
BOLOGNA, Italy--(BUSINESS WIRE)--NextSilicon, a leader in next-generation computing solutions for AI and high-performance computing (HPC), today announced plans to productize its Arbel RISC-V core into a 64-core and a 128-core, enterprise-grade processor suited to deliver ultra-speed performance for agentic tools, expected to be available in early 2028. Following an October preview, the company is now sharing expanded technical detail and a roadmap shaped by early customer and partner feedback....
-
Lewis & Clark Capital Announces the Formation of AirCore Environmental
ST. LOUIS--(BUSINESS WIRE)--Lewis & Clark Capital today announced the formation of AirCore Environmental, a new indoor air quality ("IAQ") platform built through the acquisitions of Radon Mitigation Services ("RMS") and Radon Professional Services ("RPS"). AirCore provides radon mitigation services predominantly to commercial customers across the Southeastern United States, with a mission to help property owners, managers, and builders create safer, healthier indoor environments. Formed by...
-
Riassunto: OKX lancia X-Perps sui titoli Magnificent 7, oro, argento e petrolio per i trader europei
AMSTERDAM--(BUSINESS WIRE)--OKX, una società fintech globale leader nel settore, nonché piattaforma di trading di criptovalute, oggi ha lanciato 13 nuovi mercati X-Perp per trader in tutta Europa, dando agli utenti retail un accesso diretto ai futures sui titoli tecnologici "Magnificent 7", quattro principali materie prime e i principali* indici mondiali. A partire da oggi, i clienti OKX in Europa possono negoziare futures su Apple, Amazon, Alphabet, Meta, Microsoft, Nvidia e Tesla, assieme a o...
-
Hack The Box and Semperis Form Strategic Technology Alliance to Advance Enterprise Identity Resilience
NEW YORK & HOBOKEN, New Jersey--(BUSINESS WIRE)--Hack The Box (HTB), the global leader in AI cybersecurity readiness, and Semperis, the identity-driven cyber resilience and crisis management company, today announced a strategic technology alliance. The alliance brings together Semperis’ hybrid identity-security expertise with HTB’s hands-on cyber readiness platform, supporting security teams with the skills, workflows, and response capabilities needed to prepare for and respond to identity-base...
-
Organisation d’une visioconférence destinée aux actionnaires et investisseurs particuliers de Winamp Group
BRUXELLES--(BUSINESS WIRE)--Regulatory News: Winamp Group SA (Paris: ALWIN) (Brussels: ALWIN), propriétaire des plateformes Winamp, Bridger, Jamendo et Hotmix, annonce l’organisation d’une visioconférence à destination des actionnaires et investisseurs individuels le : LUNDI 22 juin à 18H00 (Version FR) Cette visioconférence sera l’occasion de revenir sur les dernières actualités du groupe, les avancées stratégiques du premier semestre 2026 ainsi que les priorités et perspectives pour le second...