

Newsroom
Sorted by: Latest
-
E3 Lithium Executes Contribution Agreement Underpinning up to $36.5 million in Federal Support to Accelerate Clearwater Project
CALGARY, Alberta--(BUSINESS WIRE)--E3 LITHIUM LTD. (TSXV: ETL) (FSE: OW3) (OTCQX: EEMMF), “E3”, “E3 Lithium” or the “Company,” a leader in Canadian lithium development, announces that all conditions associated with the previously announced federal government funding have now been met. The Company has executed the contribution agreement confirming up to $36,507,091 of non-repayable funding through Natural Resources Canada (NRCan)’s Global Partnerships Initiative (“GPI”) (the “Funding”), to accel...
-
Captivate Your Audience with the New Logitech Spotlight 2 Advanced Presenter, Featuring Haptics and Digital Highlighting
SAN JOSE, Calif. & LAUSANNE, Switzerland--(BUSINESS WIRE)--Logitech (SIX: LOGN) (NASDAQ: LOGI) today announced Spotlight 2, a premium advanced presenter designed to keep audiences fully engaged. Raising expectations in the presenters category, the device moves beyond simple control to deliver a first-of-its-kind guided breathing experience alongside an intuitive, force-sensitive highlighting button with subtle haptic feedback. Engineered to build confidence before a speaker even steps on stage,...

-
Logitech Launches Mobi Fold, Its First Ultra-Portable Foldable Mouse for Life On the Go
SAN JOSE, Calif. & LAUSANNE, Switzerland--(BUSINESS WIRE)--Logitech (SIX: LOGN) (NASDAQ: LOGI) today solved a major pain point for traveling professionals with the introduction of Mobi Fold and Mobi Fold for Business. As Logitech’s first foldable mouse, Mobi Fold is engineered to allow users to reclaim their full productivity potential with comfort, whether they are in an airport lounge, a bustling cafe, or a hotel lobby. For the modern professional, work is no longer anchored to a desk, it hap...

-
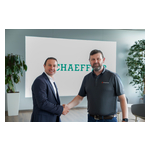
Schaeffler and Sonatus Bring Edge AI to Motion Control for Software-Defined Vehicles
HERZOGENAURACH, Germany & SUNNYVALE, Calif.--(BUSINESS WIRE)--Schaeffler and Sonatus partner to embed Edge AI in SDV control units, enabling smarter vehicles, faster development, and continuous updates....

-
Smead Capital Management Extends International Value Strategy to Global Investors Through New Fund
PHOENIX--(BUSINESS WIRE)--Smead Capital Management, a Phoenix-based investment management firm and a leader in value investing, today announced the launch of the Smead Global ex-US Value UCITS Fund designed to provide global investors with access to a product modeled after the firm’s long-standing Smead International Value Strategy. The Smead Global ex-US Value UCITS Fund is domiciled in Luxembourg. Investors can access the fund through Smead Capital Management’s website and it is available to...
-
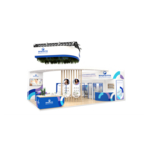
Roquette Showcases Scalable Drug Delivery Innovations at CPHI China 2026
SHANGHAI--(BUSINESS WIRE)--Roquette, a global leader in plant-based ingredients and pharmaceutical excipients, will showcase its comprehensive portfolio of innovative drug delivery solutions at CPHI & PMEC China 2026, taking place June 16-18 at the Shanghai New International Expo Centre (SNIEC). Under the theme “One Roquette for Innovations,” Roquette’s Health & Pharma Solutions Business Unit will exhibit at booth E3D26, highlighting how its deep scientific expertise and technical capab...
-
Schaeffler und Sonatus bringen KI-Algorithmen auf Steuergeräte für softwaredefinierte Fahrzeuge
Herzogenaurach, Deutschland und Sunnyvale, Kalifornien--(BUSINESS WIRE)--Schaeffler und Sonatus bringen Edge-KI in SDV-Steuergeräte, um Entwicklung zu beschleunigen und Fahrzeuge kontinuierlich zu verbessern....
-
Dodge startet Vorbestellungen für den Charger der nächsten Generation in Europa
TURIN, Italien--(BUSINESS WIRE)--Eine Ikone tritt in die nächste Generation ein Dodge feiert in diesem Jahr sein 60- jähriges Jubiläum und schlägt mit der Einführung der neuen Generation des Dodge Charger ein kühnes neues Kapitel in Europa auf. Damit kehrt eines der legendärsten amerikanischen Muscle-Cars auf die europäischen Straßen zurück – dank einer neuen Modellpalette mit verschiedenen Antriebsvarianten, die darauf ausgelegt ist, Leistung und Charakter ohne Kompromisse zu bieten. Sechs Jah...
-
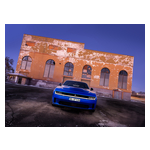
Dodge Opens Orders for the Next Generation Charger in Europe
TURIN, Italy--(BUSINESS WIRE)--An Icon Enters Its Next Generation Celebrating its 60th anniversary this year, Dodge opens a bold new chapter in Europe with the launch of the next-generation Dodge Charger, bringing one of America’s most iconic muscle cars back to European roads through a new multi-energy lineup engineered to deliver performance and attitude without compromise. Six decades after the original Charger helped define the muscle car era, this new eighth-generation model evolves the fo...

-
Dodge start bestellingen voor de volgende generatie Charger in Europa
TURIJN, Italië--(BUSINESS WIRE)--Een icoon luidt een nieuw tijdperk in Dodge viert dit jaar zijn 60 -jarig jubileum en slaat een gewaagd nieuw hoofdstuk open in Europa met de introductie van de volgende generatie Dodge Charger. Hiermee keert een van Amerika’s meest iconische muscle cars terug op de Europese wegen, dankzij een nieuwe reeks modellen met verschillende aandrijfvormen die zijn ontworpen om prestaties en karakter te leveren zonder in te leveren op prestaties. Zestig jaar nadat de ori...
