

Newsroom
Sorted by: Latest
-
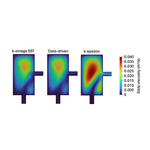
Argonne’s AI transformers to improve nuclear reactor simulations
LEMONT, Ill.--(BUSINESS WIRE)--AI transformers model complex physical systems and improve fluid-dynamics simulations for advanced nuclear reactors....
-
Grindr for Equality zobowiązuje się zapewnić, aby do 2028 r. informacje na temat usług w zakresie profilaktyki HIV dotarły do 10 mln osób
RIO DE JANEIRO--(BUSINESS WIRE)--Dziś podczas Międzynarodowej Konferencji AIDS 2026 inicjatywa Grindr for Equality zobowiązała się do zapewnienia, aby do 2028 r. informacje na temat profilaktyki HIV dotarły do dziesięciu milionów osób LGBTQ+, wykorzystując w tym celu zasięg swojej platformy, aby wesprzeć globalne wysiłki na rzecz wyeliminowania HIV do 2030 r. Zobowiązanie to jest wynikiem ustaleń nowego raportu inicjatywy Grindr for Equality pt. Closing the Gap [Wyeliminować lukę], który opisuj...
-
ADTN Investor Alert: Levi & Korsinsky Notifies Investors of Investigation Into ADTRAN Holdings (ADTN)
NEW YORK--(BUSINESS WIRE)--ADTRAN Holdings (NASDAQ: ADTN) shares fell approximately 15% on July 22, 2026 after the company announced preliminary unaudited Q2 2026 revenue of $280 million to $282 million and non-GAAP operating margin of about 3.5% to 4.0%, both below its guidance of $283 million to $303 million in revenue and 5% to 9% non-GAAP operating margin. If this decline hit your ADTN investment, you are encouraged to submit your information now. You may also contact Joseph E. Levi, Esq. a...

-
REEV Launches Pivotal Clinical Study of DREEVEN for Post-Stroke Mobility
BOSTON--(BUSINESS WIRE)--REEV launches its pivotal clinical study of the DREEVEN robotic knee brace in post-stroke mobility in clinical and home settings....

-
RDY Investor Alert: Levi & Korsinsky Notifies Investors of Investigation Into Dr. Reddy’s Laboratories (RDY)
NEW YORK--(BUSINESS WIRE)--RDY shareholders saw Dr. Reddy’s Laboratories (NYSE: RDY) shares fall approximately 9% on July 22, 2026, after Q1 FY27 results included a ₹2.4 billion provision tied to out-of-spec semaglutide batches while FY27 margin commentary remained in focus. Investors who lost money on RDY after that provision disclosure are encouraged to act now. Levi & Korsinsky is investigating potential securities law violations involving Dr. Reddy’s forward-looking profitability stateme...
-
Charles Schwab Investment Management, Inc. UK Regulatory Announcement: Form 8.3
LONDON--(BUSINESS WIRE)-- FORM 8.3 PUBLIC OPENING POSITION DISCLOSURE/DEALING DISCLOSURE BY A PERSON WITH INTERESTS IN RELEVANT SECURITIES REPRESENTING 1% OR MORE Rule 8.3 of the Takeover Code (the “Code”) 1. KEY INFORMATION (a) Full name of discloser: Charles Schwab Investment Management, Inc. (CSIM) in its capacity as investment advisor to clients. CSIM expressly disclaims beneficial ownership of the shares described in this form 8.3. (b) Owner or controller of interests and short positions...
-
Options Strengthens North America Presence with New York Office Expansion In the Heart of Wall Street
LONDON & NEW YORK & HONG KONG--(BUSINESS WIRE)--Options Technology (Options), the leading provider of IT infrastructure to global financial institution managed services, today announced the expansion of its New York office. This expansion comes after increased client growth and surging demand across North America for the firm’s trading infrastructure and market data solutions. The 34,000 square foot office, located in the heart of the Financial District, expands Options footprint in the city by...
-
SEPRO Scientific Reports Restoration of 637,000 Acres and Protection of More Than 693 Billion Gallons of Water in 2025
CARMEL, Ind.--(BUSINESS WIRE)--SEPRO Scientific™ today released its 2025 Sustainability Report, reporting 637,000 acres restored and protected and more than 693 billion gallons of water restored and protected during the year. The report highlights SEPRO's progress toward its goal of restoring 5 million acres and protecting 50,000 waterbodies by 2030, while demonstrating how digital intelligence and science-led solutions are helping customers restore and protect ecosystems at scale.The report det...
-
SLBが2026年第2四半期決算を発表
ロンドン--(BUSINESS WIRE)--(ビジネスワイヤ) -- SLB(NYSE:SLB)は、2026年第2四半期の決算を発表しました。 第2四半期の業績 (単位:100万、ただし1株当たりの金額を除く) 四半期 変化率 2026年6月30日締め 2026年3月31日締め 2025年6月30日締め 前四半期比 前年同期比 売上高 $8,972 $8,721 $8,546 3% 5% 税引前利益 - GAAPベース $1,018 $956 $1,285 6% -21% 税引前利益率 - GAAPベース 11.3% 11.0% 15.0% 38 bps -369 bps SLBに帰属する純利益 - GAAPベース 786 $752 $1,014 5% -22% 希薄化後1株当たり利益 - GAAPベース $0.52 $0.50 $0.74 4% -30% 調整後EBITDA* $1,899 $1,773 $2,051 7% -7% 調整後EBITDA利益率* 21.2% 2...
-
SLB公布2026年第二季度业绩
伦敦--(BUSINESS WIRE)--(美国商业资讯)-- SLB (NYSE: SLB)今天公布了2026年第二季度业绩。 第二季度业绩 (单位:百万美元,每股金额除外) 截至以下日期的三个月 变化 2026年6月30日 2026年3月31日 2025年6月30日 环比 同比 营收 $8,972 $8,721 $8,546 3% 5% 税前收入 - 基于GAAP $1,018 $956 $1,285 6% -21% 税前收入利润率 - 基于GAAP 11.3% 11.0% 15.0% 38 bps -369 bps 归属于SLB的净收入 - 基于GAAP $786 $752 $1,014 5% -22% 摊薄后每股收益 - 基于GAAP $0.52 $0.50 $0.74 4% -30% 调整后EBITDA* $1,899 $1,773 $2,051 7% -7% 调整后EBITDA利润率* 21.2% 20.3% 24.0% 83 bps -284 bps 税前分...
