Newsroom
Sorted by: Latest
-
Pure Lithium Corporation Named World Economic Forum Technology Pioneer
CHICAGO--(BUSINESS WIRE)--Pure Lithium Corporation, a disruptive lithium metal battery technology company, is pleased to announce that the company has been selected as a 2026 Technology Pioneer by the World Economic Forum. Launched in 2000, the Technology Pioneers is a leading community for companies from around the world that are shaping the future through breakthrough technologies and innovations. These companies are selected for their potential to have a significant impact on business and so...
-
ZG and Z DEADLINE ALERT: Faruqi & Faruqi, LLP Reminds Zillow Group (ZG, Z) Investors of Securities Class Action Lawsuit Deadline on August 10, 2026
NEW YORK--(BUSINESS WIRE)--Faruqi & Faruqi, LLP, a leading national securities law firm, is investigating potential claims against Zillow Group, Inc. (“Zillow” or the “Company”) (NASDAQ: ZG) (NASDAQ: Z) and reminds investors of the August 10, 2026 deadline to seek the role of lead plaintiff in a federal securities class action that has been filed against the Company. Faruqi & Faruqi is a leading national securities law firm with offices in New York, Pennsylvania, California and Georgia....

-
Andersen Global baut seine Kompetenzen im Bereich globale Mobilität durch die Aufnahme von Courdid BV weiter aus
SAN FRANCISCO--(BUSINESS WIRE)--Andersen Global hat eine Kooperationsvereinbarung mit Courdid BV, einem in den Niederlanden ansässigen Unternehmen für globale Mobilität, geschlossen und damit seine Beratungskompetenzen im Bereich grenzüberschreitende Personalangelegenheiten und Entsendungen weiter ausgebaut. Das vor fast zwei Jahrzehnten gegründete Unternehmen Courdid BV bietet ein umfassendes Spektrum an Beratungsdienstleistungen in den Bereichen Lohnsteuer, Besteuerung von im Ausland tätigen...
-
Forsee Power annonce la mise à disposition des documents préparatoires à l’Assemblée Générale Mixte du 29 juin 2026
PARIS--(BUSINESS WIRE)--Regulatory News: Forsee Power (Paris:ALFOR) (FR0014005SB3 – FORSEE – la « Société »), expert des systèmes de batteries pour les véhicules électriques commerciaux et industriels, annonce la mise à disposition ce jour des documents préparatoires à l’Assemblée Générale Mixte du 29 juin 2026, qui se tiendra à 10h00 en présentiel au siège social de la société, situé 1, boulevard Hippolyte Marquès – 94 200 Ivry-sur-Seine. L’avis de réunion comportant l’ordre du jour, le projet...
-
Visa Announces New AI, Stablecoin and Token Innovations to Power Intelligent, Programmable Commerce at Visa Payments Forum
SAN FRANCISCO--(BUSINESS WIRE)--At Visa Payments Forum 2026, Visa (NYSE: V) today announced new AI, stablecoin and token capabilities designed to help clients unlock the next generation of commerce. These innovations reflect a simple objective: ensuring trust, security and control evolve alongside increasingly fast, automated and intelligent commerce experiences. In a keynote presentation, Jack Forestell, Chief Product & Strategy Officer at Visa, outlined how two foundational shifts—artific...

-
Fubo Announces Distribution Agreement With NBCUniversal
NEW YORK--(BUSINESS WIRE)--FuboTV Inc. (NYSE: FUBO) announced today a distribution agreement with NBCUniversal. Starting today, Fubo customers can stream NBCUniversal’s Spanish-language networks, Telemundo and Universo, with NBCU’s English-language networks, including the new NBC Sports Network (NBCSN), regional sports networks (RSNs) and new FAST channels, to launch in the coming weeks. Customers will be able to access NBCUniversal programming through multiple Fubo plan options, including: NBC...
-
KARL STORZ Announces FDA Clearance for Rubina Lens for Open Surgery
EL SEGUNDO, Calif.--(BUSINESS WIRE)--KARL STORZ, a global leader in endoscopic and minimally invasive surgical technology, has received FDA clearance for the Rubina™ Lens exoscope for open surgery, broadening the company’s near-infrared (NIR) imaging ecosystem across open and minimally invasive procedures in the United States. The digital, camera‑based Rubina™ Lens exoscope displays a real‑time, magnified 4K image of the surgical field on a monitor. With the ability to switch into NIR imaging u...

-
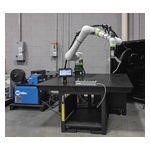
Miller Expands Copilot™ Family to Address Larger Weldments and Aluminum Applications
APPLETON, Wis.--(BUSINESS WIRE)--Miller Electric Mfg. LLC, a leading worldwide manufacturer of Miller® brand arc welding equipment, announces the expansion of its Copilot family with two new product variations: Copilot Builder with FANUC CRX‑30 and Copilot with XR-AlumaPro™ CB torch. These build on the Copilot platform’s promise of making robotic welding easier to adopt, more flexible to configure and capable of growing alongside evolving production needs while addressing a wider array of weldi...
-
Upshop Unveils AI Innovations That Drive Retail Performance
AUSTIN, Texas--(BUSINESS WIRE)--Upshop, the leading provider of AI-powered retail operations software, announced today several innovations at its Altitude 2026 conference being held in Denver, Colorado. Upshop is introducing several new innovations to help retailers, large and small, streamline their operations. These intelligent solutions enable retailers to predict customer needs with greater precision, act faster in-store and ultimately turn better decisions into stronger financial results....

-
Visa Partners with OpenAI to Power the Next Generation of AI Commerce
SAN FRANCISCO--(BUSINESS WIRE)--Visa (NYSE: V) today announced a strategic collaboration with OpenAI to enable secure Visa payments within agentic commerce, enabling seamless and trusted payments across OpenAI. The companies made the announcement at the Visa Payments Forum in San Francisco. Through the partnership, Visa will provide its global network, credentialing capabilities and security infrastructure to support agentic commerce experiences, helping consumers and businesses interact and tr...