

Newsroom
Sorted by: Latest
-
Zoho Corporation Unveils Nathu La, a Designed-in-House Server, in a Move Towards Technological Sovereignty and Inference Cost Reduction
AUSTIN, Texas--(BUSINESS WIRE)--Zoho Corporation, a global technology company and parent company of Zoho and ManageEngine, today announced the launch of Nathu La, a designed in-house server and a pivotal step in the company's journey toward building its full technology stack, from the hardware layer to the software applications. With Nathu La, Zoho has achieved equivalent performance with 12-18% lower power consumption and 20-30% lower total cost of ownership (TCO), and in turn, bringing down i...
-
Mitsubishi Electric Awarded Subsidy to Develop Flexible Space Mobility Technology under JAXA’s Space Strategy Fund
TOKYO--(BUSINESS WIRE)--Mitsubishi Electric Corporation (TOKYO: 6503) announced today that it has been awarded a subsidy for the Development of Inter-Orbit Transportation Vehicles (OTVs) under the Technology for Realizing Flexible Mobility in Space program, which is being financed by the 2nd Phase of the Space Strategy Fund managed by the Japan Aerospace Exploration Agency (JAXA). The company was previously selected as a representative organization for the project and will develop OTVs in that...
-
Blue Planet Prize 2026: Announcement of Prize Laureates
TOKYO--(BUSINESS WIRE)--This year marks the 35th awarding of the Blue Planet Prize, the international environmental award sponsored by the Asahi Glass Foundation, chaired by Takuya Shimamura. Every year, the Foundation selects two laureates, individuals, or organizations who have made significant contributions towards the resolution of global environmental problems. The Board of Directors has selected the following 2026 Blue Planet Prize laureates. 1. Dr. Linda S. Birnbaum (USA) born December 2...

-
Autel Highlights Grid-Aware and Fleet-Focused Charging Technologies at Sydney EV Charging Innovation Seminar
SYDNEY--(BUSINESS WIRE)--Autel Energy hosted its “Powering the Future – Autel 2026 EV Charging Innovation Seminar” in Sydney on 9 June....

-
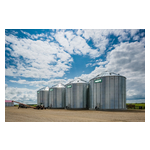
AGI Realigns Manufacturing to Deliver Storage Solutions Closer to U.S. Farmers
CLAY CENTER, Kan.--(BUSINESS WIRE)--Ag Growth International Inc. (“AGI”) today announced a multi-million dollar investment in its Clay Center, Kansas facility to add U.S. production of 4-inch corrugated farm grain bins and strengthen its North American manufacturing network. The project is part of AGI’s long-term strategy to align production with customer demand across key grain-growing regions—enhancing responsiveness, increasing production speed, and delivering high-quality storage solutions...
-
オアシス、責任回避を続ける高畑社長と高木取締役の再任議案への反対を株主に要請
香港--(BUSINESS WIRE)--(ビジネスワイヤ) -- オアシス・マネジメント・カンパニー・リミテッド(以下「オアシス」または「当社」)は、株式会社エス・エム・エス(2175 JP)(以下「SMS」または「同社」)の株式を18.3%保有するファンドの運用会社として、より「強い」SMSキャンペーンを5月28日に発表しました。 オアシスは、来る株主総会にてSMSの株主の皆様に対し、以下の2点を求めています。 代表取締役社長である高畑 正樹氏の再任案への反対 社外取締役である高木 暢子氏の再任案への反対 オアシスは、株主、従業員、取引先、その他ステークホルダーの皆様に我々の主張を伝えるため、キャンペーンサイト「ABetterSMS.com」を開設し、リーダーシップ刷新の必要性を説明する詳細なプレゼンテーション資料を公開しています。 本プレゼン資料はこちらからご覧いただけます。 SMSは6月5日付で、オアシスが発表したキャンペーンに対する見解を公表しました。しかし、その内容には、これまでの経営責任や企業価値の毀損に正面から向き合う姿勢ではなく、自社の取り組みを正当化し、現体制の維...
-
Oasis Urges Shareholders to Vote AGAINST President Takahata and Director Takagi at SMS AGM for Continued Refusal to Accept Accountability
HONG KONG--(BUSINESS WIRE)--Oasis Management Company Ltd. (“Oasis”), the investment manager to private funds that own approximately 18.3% of the shares in SMS Co., Ltd. (2175 JP) (“SMS” or the “Company”), launched the “A Better SMS” campaign on May 28. For the upcoming SMS AGM, Oasis is calling on fellow shareholders to: Vote AGAINST the reappointment of President Masaki Takahata as a director; and Vote AGAINST the reappointment of Nobuko Takagi as a director. To make its case directly to fello...
-
SLB與Qualcomm攜手合作,為能源營運打造邊緣AI解決方案
休士頓--(BUSINESS WIRE)--(美國商業資訊)-- 全球性能源科技公司SLB (NYSE: SLB)今日宣布與Qualcomm Technologies, Inc.簽署合作備忘錄,旨在為能源產業打造邊緣AI解決方案,以支援油井、設施和生產系統各環節的即時營運決策。 此次合作結合了Qualcomm Technologies在低功耗邊緣運算和AI處理方面的能力,以及SLB專為偏遠的複雜營運環境開發的Agora™邊緣AI與物聯網解決方案。 SLB數位業務總裁Rakesh Jaggi表示:「SLB與Qualcomm Technologies攜手致力於協助營運商在整個能源基礎設施中更有效地應用AI。許多能源營運仰賴在偏遠環境中進行即時決策,而網路連線和回應速度直接影響著營運表現。圍繞能源營運實際情況設計的AI系統,有助於在這些環境中支援更加一致且自主的工作流程。」 隨著能源營運商在生產環境中越來越多地採用自動化和自主工作流程,市場對能夠貼近實際營運而非僅仰賴集中式系統運行的代理式AI系統的需求不斷成長。在連線性、延遲和營運連續性至關重要的偏遠能源基礎設施中,將AI部署得更靠近設備和...
-
SLB携手Qualcomm,为能源运营打造边缘AI解决方案
休斯顿--(BUSINESS WIRE)--(美国商业资讯)-- 全球能源科技公司SLB (NYSE: SLB)今日宣布与Qualcomm Technologies, Inc.签署谅解备忘录,旨在为能源行业打造边缘AI解决方案,以支持油井、设施和生产系统各环节的实时运营决策。 此次合作结合了Qualcomm Technologies在低功耗边缘计算和AI处理方面的能力,以及SLB专为偏远的复杂运营环境开发的Agora™边缘AI与物联网解决方案。 SLB数字业务总裁Rakesh Jaggi表示:“SLB与Qualcomm Technologies携手致力于帮助运营商在整个能源基础设施中更有效地应用AI。许多能源运营依赖于在偏远环境中进行实时决策,而网络连接和响应速度直接影响着运营表现。围绕能源运营实际情况设计的AI系统,有助于在这些环境中支持更加一致且自主的工作流。” 随着能源运营商在生产环境中越来越多地采用自动化和自主工作流,市场对能够贴近实际运营而非仅依赖集中式系统运行的智能体AI系统的需求不断增长。在连接性、延迟和运营连续性至关重要的偏远能源基础设施中,将AI部署得更靠近设备和运营...
-
SLB colabora com a Qualcomm em soluções de IA de ponta para operações de energia
HOUSTON--(BUSINESS WIRE)--A SLB (NYSE: SLB), empresa global de tecnologia energética, anunciou hoje um memorando de entendimento com a Qualcomm Technologies, Inc. para viabilizar soluções de IA de ponta para o setor de energia, apoiando a tomada de decisões operacionais em tempo real em poços, instalações e sistemas de produção. Essa colaboração combina a computação de ponta de baixo consumo de energia e os recursos de processamento de IA da Qualcomm Technologies com as soluções de IA e IoT de...