

Newsroom
Sorted by: Latest
-
First Trust Global Funds PLC UK Regulatory Announcement: Net Asset Value(s)
LONDON--(BUSINESS WIRE)-- Funds Date TIDM ISIN Code Shares in Issue Currency Net Asset Value NAV/per Share First Trust Vest US Equity Max Buffer UCITS ETF - March 10.06.2026 MMAR.LN IE0002PPCMH6 50,002.00 USD 1,324,961.42 26.498 ...
-
First Trust Global Funds PLC UK Regulatory Announcement: Net Asset Value(s)
LONDON--(BUSINESS WIRE)-- Funds Date TIDM ISIN Code Shares in Issue Currency Net Asset Value NAV/per Share First Trust Bloomberg Nuclear Power UCITS ETF 10.06.2026 RCTR.LN IE000J5PESP7 150,002.00 USD 2,638,785.43 17.592 ...
-
First Trust Global Funds PLC UK Regulatory Announcement: Net Asset Value(s)
LONDON--(BUSINESS WIRE)-- Funds Date TIDM ISIN Code Shares in Issue Currency Net Asset Value NAV/per Share First Trust Europe Rising Dividend Achievers UCITS ETF 10.06.2026 EDVY.LN IE000CPG9HG3 75,002.00 EUR 1,603,025.31 21.373 ...
-
First Trust Global Funds PLC UK Regulatory Announcement: Net Asset Value(s)
LONDON--(BUSINESS WIRE)-- Funds Date TIDM ISIN Code Shares in Issue Currency Net Asset Value NAV/per Share First Trust Vest US Equity Max Buffer UCITS ETF - December 10.06.2026 MDEC.LN IE0007FIJUO5 50,002.00 USD 1,397,475.88 27.948 ...
-
First Trust Global Funds PLC UK Regulatory Announcement: Net Asset Value(s)
LONDON--(BUSINESS WIRE)-- Funds Date TIDM ISIN Code Shares in Issue Currency Net Asset Value NAV/per Share First Trust Europe Growth Strength UCITS ETF 10.06.2026 FTEG.LN IE0009F7UB30 125,002.00 EUR 2,588,381.91 20.707 ...
-
Riassunto: Thales annuncia una partnership strategica con Google Cloud per il lancio di un nuovo cloud sovrano in Germania
BERLINO--(BUSINESS WIRE)--Thales, leader globale in tecnologie di alto livello, ha annunciato oggi una partnership strategica con Google Cloud per la creazione di una nuova soluzione cloud sovrana in Germania. Il testo originale del presente annuncio, redatto nella lingua di partenza, è la versione ufficiale che fa fede. Le traduzioni sono offerte unicamente per comodità del lettore e devono rinviare al testo in lingua originale, che è l'unico giuridicamente valido....
-
UK Debt Management Office UK Regulatory Announcement: Issue of Debt
LONDON--(BUSINESS WIRE)-- DMO-TAS041/3681/003 The Minster Building21 Mincing LaneLondonEC3R 7AG T 020 7862 6500F 020 7862 6509www.dmo.gov.uk A075\26 11 June 2026 PRESS NOTICE RESULT OF THE SALE BY AUCTION OF £5000 MILLION OF 4% TREASURY GILT 2029The United Kingdom Debt Management Office ("DMO") announces that the auction of £5,000 million of 4% Treasury Gilt 2029 (ISIN Code: GB00BVP99566) has been allocated as follows:(Note: all prices in this notice are quoted in pounds...
-
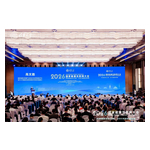
Conférence sur l’Internet de l’énergie de Chine 2026 lancée à Qingdao, mettant en avant la transformation numérique et verte
QINGDAO, Chine--(BUSINESS WIRE)--La Conférence sur l’Internet de l’énergie de Chine 2026 s’est ouverte le 6 juin à Qingdao, dans la province du Shandong, à l’est de la Chine. Elle a réuni plus de 1 000 responsables gouvernementaux, experts du secteur, universitaires ainsi que des représentants d’entreprises énergétiques, d’instituts de recherche et du secteur financier, afin d’explorer des voies de transformation énergétique de haute qualité pour la Chine. La conférence de deux jours est organi...

-
China Energy Internet Conference 2026 Kicks Off in Qingdao, Highlighting Digital and Green Transformation
QINGDAO, China--(BUSINESS WIRE)--The 2026 China Energy Internet Conference kicked off on June 6 in Qingdao, East China's Shandong Province, gathering over 1,000 government officials, industry elites, scholars and representatives from energy firms, research institutions and financial sectors to explore high-quality pathways for China's energy transformation. The two-day event is hosted by Tsinghua University and organized by its Energy Internet Research Institute. Co-organizers include the unive...
-
Faire célèbre cinq années de croissance hors Amérique du Nord : plus de 100 000 détaillants, 50 000 marques, avec plus d’une marque sur quatre qui effectuent désormais des ventes transfrontalières
LONDRES--(BUSINESS WIRE)--Cinq ans après son lancement en dehors de l'Amérique du Nord, la communauté Faire, qui compte plus de 100 000 détaillants et 50 000 marques répartis dans plus de 30 pays d'Europe, d'Australie et de Nouvelle-Zélande, témoigne d'un secteur du commerce de détail innovant et en plein essor, même très loin des grands centres urbains. « Faire, qui a vécu une période exceptionnelle à l'international pendant les cinq dernières années, voit se dessiner des perspectives d'avenir...
