

Newsroom
Sorted by: Latest
-
Saudi Arabia at the Center of the Global Water Industry as IDWS 2026 Reshapes the Future of Water
JEDDAH, Saudi Arabia--(BUSINESS WIRE)--Saudi Arabia at the Center of the Global Water Industry as IDWS 2026 Reshapes the Future of Water...
-
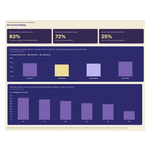
Plan B Amplifies the Voice of American Voters: 83 Percent Say Emergency Contraception Should Be Easily Accessible for Women
WASHINGTON--(BUSINESS WIRE)--Plan B Amplifies the Voice of American Voters: 83 Percent Say Emergency Contraception Should Be Easily Accessible for Women...
-
Xsolla patrocinará First Playable Florence 2026 para ayudar a los desarrolladores independientes de PC a perfeccionar sus presentaciones ante editores y descubrir una alternativa escalable a la adquisición de usuarios mediante publicidad
LOS ÁNGELES--(BUSINESS WIRE)--Xsolla, empresa líder global en soluciones comerciales para videojuegos, ha anunciado hoy su patrocinio de First Playable Florence (FPF) 2026, el principal encuentro anual de Europa para desarrolladores independientes que buscan acuerdos de publicación, inversión y alianzas con plataformas. El próximo 11 de junio, en Florencia (Italia), Xsolla organizará dos actividades dirigidas a desarrolladores, lideradas por Inês Ramalho, especialista de la empresa en crecimien...

-
Xsolla sponsorizzerà First Playable Florence 2026, dotando gli sviluppatori indipendenti di giochi su PC di strategie di presentazione agli editori e un'alternativa scalabile all'acquisizione pagata
LOS ANGELES--(BUSINESS WIRE)--Xsolla, azienda leader mondiale nel commercio di videogiochi, oggi ha annunciato la sua sponsorizzazione di First Playable Florence (FPF) 2026, il prestigioso raduno annuale europeo per gli sviluppatori indipendenti di videogiochi alla ricerca di accordi di pubblicazione, investimenti e collaborazioni con piattaforme. L'11 giugno, a Firenze, Xsolla ospiterà due iniziative di programmazione dedicate agli sviluppatori guidate da Inês Ramalho, l'esperta di Xsolla nell...

-
Xsolla sponsort First Playable Florence 2026 en biedt indie pc-ontwikkelaars strategieën voor uitgeverspresentaties en een schaalbaar alternatief voor betaalde acquisitie
LOS ANGELES--(BUSINESS WIRE)--Xsolla, een toonaangevend wereldwijd bedrijf in de videogamehandel, heeft vandaag aangekondigd dat het First Playable Florence (FPF) 2026 sponsort, de belangrijkste jaarlijkse bijeenkomst van Europa voor onafhankelijke game-ontwikkelaars die op zoek zijn naar uitgeefcontracten, investeringen en platformpartnerschappen. Op 11 juni organiseert Xsolla in Florence, Italië, twee programmaonderdelen gericht op ontwikkelaars, onder leiding van Inês Ramalho, Xsolla's exper...

-
First Trust Global Funds PLC UK Regulatory Announcement: Net Asset Value(s)
LONDON--(BUSINESS WIRE)-- Funds Date TIDM ISIN Code Shares in Issue Currency Net Asset Value NAV/per Share First Trust Capital Strength UCITS ETF 10.06.2026 FTCS. IE00BL0L0D23 300,002.00 USD 9,771,923.19 32.573 ...
-
Xsolla sponsert die „First Playable Florence 2026“ und unterstützt Indie-PC-Entwickler mit Strategien für Publisher-Pitches sowie einer skalierbaren Alternative zur bezahlten Nutzerakquise
LOS ANGELES--(BUSINESS WIRE)--Xsolla, ein weltweit führendes Unternehmen im Bereich Videospiel-Commerce, gab heute bekannt, dass es die „First Playable Florence“ (FPF) 2026 sponsert, Europas führende jährliche Veranstaltung für unabhängige Spieleentwickler, die nach Publishing-Verträgen, Investitionen und Plattformpartnerschaften suchen. Am 11. Juni wird Xsolla in Florenz, Italien, zwei auf Entwickler ausgerichtete Programmveranstaltungen unter der Leitung von Inês Ramalho, Xsollas Expertin für...

-
Xsolla parraine le premier événement « Playable Florence 2026 », qui vise à offrir aux développeurs indépendants de jeux PC des stratégies de présentation auprès des éditeurs ainsi qu’une alternative évolutive à la stratégie d’acquisition payante
LOS ANGELES--(BUSINESS WIRE)--Xsolla, un chef de file mondial dans le domaine du commerce de jeux vidéo, a annoncé aujourd’hui son parrainage de First Playable Florence (FPF) 2026, le plus grand rendez-vous annuel européen destiné aux développeurs de jeux indépendants à la recherche de contrats d’édition, d’investissements et de partenariats avec des plateformes. Le 11 juin à Florence, en Italie, Xsolla organisera deux sessions axées sur la programmation des activations à destination des dévelo...

-
First Trust Global Funds PLC UK Regulatory Announcement: Net Asset Value(s)
LONDON--(BUSINESS WIRE)-- Funds Date TIDM ISIN Code Shares in Issue Currency Net Asset Value NAV/per Share First Trust Value Line Dividend Index UCITS ETF 10.06.2026 FVD. IE00BKVKW020 250,002.00 USD 7,282,504.68 29.130 ...
-
Best’s Market Segment Report: Specialty Legal Professional Liability Insurers Continue to Grow, Despite Varied Performance
OLDWICK, N.J.--(BUSINESS WIRE)--Insurers specializing in the legal professional liability (LPL) sector have experienced considerable growth in policyholders’ surplus over the past five years, but premium levels have remained relatively stagnant during that timeframe, according to a new AM Best report. The Best’s Market Segment Report, titled “Specialty Legal Professional Liability Insurers Continue to Grow, Despite Varied Performance,” takes note of the myriad challenges facing law firms, such...