


TEL AVIV, Israel--(BUSINESS WIRE)--Teva Pharmaceutical Industries Ltd. (NYSE and TASE: TEVA) today reported results for the year and the quarter ended December 31, 2019.
Full-Year 2019 and Q4 2019 Highlights: |
||||
FY 2019 |
Q4 2019 |
|||
Revenues |
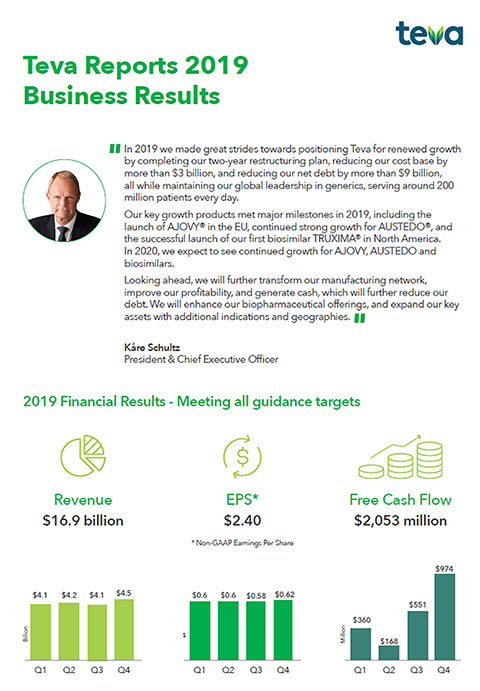
$16.9 billion |
$4.5 billion |
||
Revenues prior to revision (*) |
$17.5 billion |
$4.6 billion |
||
Cash flow from operating activities |
$748 million |
$538 million |
||
Free cash flow |
$2,053 million |
$974 million |
||
GAAP earnings (loss) per share |
$(0.91) |
$0.10 |
||
Non-GAAP EPS |
$2.40 |
$0.62 |
(*) |
|
Revision of prior period financial statements with respect to the distribution business in our International Markets segment, decreasing sales by $165 million in Q4 2019, and $642 million in 2019, with an offsetting decrease in cost of sales. No impact on gross profit, operating income, earnings per share or cash flows for the related periods. |
- Met all components of 2019 business outlook
- Achieved spend base reduction target of $3 billion
- AUSTEDO® rapid growth continues
- AJOVY® launched in Europe; auto-injector approved in U.S. and E.U.
- Launch of TRUXIMA®, Teva’s first U.S. biosimilar
-
2020 business outlook:
- Revenues are expected to be $16.6 - $17.0 billion
- Non-GAAP EPS is expected to be $2.30 - $2.55
- Free cash flow is expected to be $1.8 - $2.2 billion
“In 2019, we made great strides towards positioning Teva for renewed growth by completing our two-year restructuring plan, reducing our cost base by more than $3 billion, and reducing our net debt by more than $9 billion, all while maintaining our global leadership in generics, serving around 200 million patients every day,” said Mr. Kåre Schultz, Teva’s President and CEO.
“Our key growth products met major milestones in 2019, including the launch of AJOVY® in Europe, continued strong growth for AUSTEDO®, and the successful launch of our first biosimilar TRUXIMA® in North America. In 2020, we expect to see continued growth for AJOVY®, AUSTEDO® and our biosimilars.”
Mr. Schultz continued, “Looking ahead, we will further transform our manufacturing network, improve our profitability, and generate cash, which will further reduce our debt. We will enhance our biopharmaceutical offerings, and expand our key assets with additional indications and geographies.”
Revision of Previously Reported Consolidated Financial Statements
In connection with the preparation of Teva's consolidated financial statements for the fiscal year ended December 31, 2019, Teva determined that in the full years and interim periods of fiscal years 2017 and 2018, and the first three quarters of fiscal year 2019, it had an immaterial error in the presentation of distribution revenues from its Israeli distribution business. This business is part of the International Markets reporting segment and facilitates distribution of Teva and third party products to pharmacies, hospitals and other organizations in Israel.
Specifically, the Company concluded that it presented revenue from its Israeli distribution business on a gross basis, although it should have reported such revenue on a net basis. Because Teva has no discretion in establishing prices for any specifies goods or services, limited inventory risk and is not primarily responsible for contract fulfillment, Teva does not meet the criteria for reporting revenues from such business as a principal (on a gross basis), as opposed to as an agent (on a net basis).
The Company evaluated the cumulative impact of this item on its previously issued annual financial statements for 2017 and 2018, and the interim financial statements for 2017, 2018 and the first three quarters of 2019, and concluded that, for the reasons mentioned below, the revisions were not material, individually or in the aggregate, to any of its previously-issued interim or annual financial statements. Teva has revised its presentation of net revenue and cost of sales in the historical consolidated financial statements to reflect the change in this item, as described in more detail below.
The impact of this revision is a decrease in net revenues with an offsetting decrease in cost of sales. There is no impact on gross profit, operating income or earnings per share. In addition, there is no impact on Teva’s balance sheet or statement of cash flows for the related periods.
The following table summarizes the impact of the revision on net revenues and non-GAAP cost of sales in the consolidated statements of income in the relevant periods:
|
|
Net revenues |
|
Cost of sales |
||||||||
|
|
As reported |
|
Adjustment |
|
As revised |
|
As reported |
|
Adjustment |
|
As revised |
|
|
(U.S. $ in millions) |
||||||||||
2017 |
|
22,385 |
|
(533) |
|
21,853 |
|
10,351 |
|
(533) |
|
9,818 |
2018 |
|
18,854 |
|
(583) |
|
18,271 |
|
9,308 |
|
(583) |
|
8,725 |
Nine months ended September 30, 2019 |
|
12,896 |
|
(477) |
|
12,419 |
|
6,456 |
|
(477) |
|
5,979 |
The following items presented in this press release have been adjusted to reflect the revision described above:
- 2018 and 2019 annual and fourth quarter revenues
- 2018 and 2019 annual and fourth quarter cost of sales
- 2018 and 2019 fourth quarter International Markets segment revenues
- 2018 and 2019 fourth quarter International Markets segment cost of sales
2019 Annual Consolidated Results
Revenues in 2019 were $16,887 million, a decrease of 8%, or 5% in local currency terms, compared to 2018, mainly due to generic competition to COPAXONE®, a decline in revenues from our U.S. generics business, BENDEKA®/TREANDA® and Japan, partially offset by higher revenues from AUSTEDO, AJOVY and QVAR® in the United States. The data presented for prior periods have been revised to reflect a revision in the presentation of net revenues and cost of sales in the consolidated financial statements. See "Revision of Previously Reported Consolidated Financial Statements" above.
Exchange rate movements between 2019 and 2018 negatively impacted our revenues by $402 million, our GAAP operating income by $135 million and our non-GAAP operating income by $154 million.
GAAP gross profit was $7,537 million in 2019, a decrease of 9% compared to 2018. GAAP gross profit margin was 44.6% in 2019, compared to 45.4% in 2018. Non-GAAP gross profit was $8,702 million in 2019, a decrease of 9% compared to 2018. Non-GAAP gross profit margin was 51.5% in 2019, compared to 52.2% in 2018. The decrease in both GAAP and non-GAAP gross profit was mainly due to lower revenues from COPAXONE in North America.
GAAP Research and Development (R&D) expenses in 2019 were $1,010 million, a decrease of 17% compared to 2018. Non-GAAP R&D expenses in 2019 were $1,004 million, or 5.9% of revenues, compared to $1,102 million, or 6.0% of revenues, in 2018. The decrease in R&D expenses resulted primarily from pipeline optimization and efficiencies realized as part of our restructuring plan.
GAAP Selling and Marketing (S&M) expenses in 2019 were $2,614 million, a decrease of 10% compared to 2018. Non-GAAP S&M expenses were $2,438 million, or 14.4% of revenues, in 2019, compared to $2,718 million, or 14.9% of revenues, in 2018. The decrease was mainly due to cost reductions and efficiency measures as part of the restructuring plan.
GAAP General and Administrative (G&A) expenses in 2019 were $1,192 million, a decrease of 8% compared to 2018. Non-GAAP G&A expenses were $1,145 million in 2019, or 6.8% of revenues, compared to $1,228 million, or 6.7% of revenues, in 2018. The decrease was mainly due to cost reductions and efficiency measures as part of the restructuring plan.
GAAP other income in 2019 was $76 million, compared to $291 million in 2018. The other income in 2019 was mainly related to the sale of activities in our International Markets segment. Non-GAAP other income in 2019 was $27 million, compared to $225 million in 2018. Non-GAAP other income in 2018 was mainly due to Section 8 recoveries from multiple cases in Canada and recovery of lost profits in cases in which U.S. patent infringement litigation had previously prevented the sale of certain products.
GAAP Operating loss was $443 million in 2019, compared to operating loss of $1,637 million in 2018. The decrease was mainly due to higher impairment charges recorded in 2018, partially offset by higher provisions in connection with legal settlements and loss contingencies in 2019, as well as lower profit in our North America segment. Non-GAAP operating income was $4,142 million, a decrease of 12% compared to $4,723 million in 2018.
Adjusted EBITDA (non-GAAP operating income, which excludes amortization and certain other items, and excluding depreciation expenses) in 2019 was $4,685 million, compared to $5,319 million in 2018.
In 2019, GAAP financial expenses were $822 million, compared to $959 million in 2018. Non-GAAP financial expenses were $824 in 2019, compared to $893 in 2018.
In 2019, we recognized a GAAP tax benefit of $278 million, or 22%, on a pre-tax loss of $1,265 million. In 2018, we recognized a tax benefit of $195 million, or 8%, on a pre-tax loss of $2,596 million. Our tax rate for 2018 was lower than in 2019 due to one-time legal settlements and divestments that had a low corresponding tax effect.
Non-GAAP income taxes for 2019 were $597 million on non-GAAP pre-tax income of $3,317 million. Non-GAAP income taxes in 2018 were $519 million on non-GAAP pre-tax income of $3,830 million. The non-GAAP tax rate for 2019 was 18%, compared to 14% in 2018. Our annual non-GAAP effective tax rate for 2019 was higher than our non-GAAP effective tax rate for 2017 and 2018 primarily due to a lower tax shield on finance expenses.
In the future, both our GAAP and non-GAAP effective tax rates are expected to remain similar to the 2019 rate.
GAAP net loss attributable to Teva’s ordinary shareholders and GAAP diluted loss per share in 2019 were $999 million and $0.91, respectively, compared to net loss of $2,399 million and diluted loss per share of $2.35 in 2018. Non-GAAP net income attributable to ordinary shareholders for calculating diluted EPS and non-GAAP diluted EPS in 2019 were $2,627 million and $2.40, respectively, compared to $2,985 million and $2.92 in 2018.
The weighted average diluted shares outstanding used for the fully diluted share calculation on a GAAP basis for 2019 and 2018 were 1,091 million and 1,021 million shares, respectively. The weighted average outstanding shares used for the fully diluted EPS calculation on a non-GAAP basis for 2019 and 2018 were 1,094 million and 1,024 million shares, respectively.
As of December 31, 2019 and 2018, the fully diluted share count for purposes of calculating our market capitalization was approximately 1,108 million and 1,100 million shares, respectively.
Non-GAAP information: Net non-GAAP adjustments in 2019 were $3,625 million. Non-GAAP net income and non-GAAP EPS for the year were adjusted to exclude the following items:
- An impairment of intangible and fixed assets of 1,778 million, mainly related to the acquisition of Actavis Generics;
- Legal settlements and loss contingencies of $1,178 million, mainly related to the reserve in connection with the opioids cases;
- Amortization of purchased intangible assets totaling $1,113 million, of which $973 million is included in cost of goods sold and the remaining $139 million in selling and marketing expenses;
- Restructuring expenses of $199 million;
- Equity compensation expenses of $123 million;
- Contingent consideration of $59 million;
- Other non-GAAP items of $132 million;
- Minority interest adjustment of $82; and
- Related tax effect of $875 million.
Teva believes that excluding such items facilitates investors’ understanding of its business. For further information see the tables below for a reconciliation of the U.S. GAAP results to the adjusted non-GAAP figures and the information under “Non-GAAP Financial Measures.” Investors should consider non-GAAP financial measures in addition to, and not as replacement for, or superior to, measures of financial performance prepared in accordance with GAAP.
Cash flow generated from operating activities in 2019 was $748 million, a decrease of $1,698 million, or 69%, compared to 2018. This decrease was mainly due to the working capital adjustment with Allergan and the Rimsa settlement in 2018, and lower profit in our North America segment during 2019.
Free cash flow (Cash flow generated from operating activities in 2019, net of cash used for capital investments and beneficial interest collected in exchange for securitized trade receivables) was $2,053 million in 2019, compared to $3,679 million in 2018. The decrease in 2019 resulted mainly from the lower cash flow generated from operating activities.
As of December 31, 2019, our debt was $26,908 million, compared to $28,916 million as of December 31, 2018. The decrease was mainly due to senior notes repaid at maturity or prepaid with cash generated during the year. The portion of total debt classified as short-term as of December 31, 2019 was 9%, compared to 8% as of December 31, 2018, due to a decrease in our total debt. Our average debt maturity was approximately 6.4 years as of December 31, 2019, compared to 6.8 years as of December 31, 2018.
Annual Report on Form 10-K
Teva will file its Annual Report on Form 10-K with the SEC in the coming days. The report will include a complete analysis of the financial results for 2019 and will be available on Teva’s website, http://ir.tevapharm.com, as well as on the SEC’s website: http://www.sec.gov.
Fourth Quarter 2019 Consolidated Results
Revenues in the fourth quarter of 2019 were $4,468 million, an increase of 1%, or 2% in local currency terms, compared to the fourth quarter of 2018, mainly due to an increase in sales of AUSTEDO, AJOVY and certain respiratory products, partially offset by lower revenues from COPAXONE in North America.
Exchange rate differences between the fourth quarter of 2019 and the fourth quarter of 2018 negatively impacted our revenues and GAAP operating income by $47 million and $27 million, respectively. Our non-GAAP operating income was negatively impacted by $29 million.
GAAP gross profit was $1,958 million in the fourth quarter of 2019, a decrease of 1% compared to the fourth quarter of 2018. GAAP gross profit margin was 43.8% in the fourth quarter of 2019, compared to 44.6% in the fourth quarter of 2018. Non-GAAP gross profit was $2,262 million in the fourth quarter of 2019, a decrease of 3% compared to the fourth quarter of 2018. Non-GAAP gross profit margin was 50.6% in the fourth quarter of 2019, compared to 52.7% in the fourth quarter of 2018. The decrease in non-GAAP gross profit margin in the fourth quarter of 2019 resulted primarily from a decline in revenues from COPAXONE.
GAAP Research and Development (R&D) expenses in the fourth quarter of 2019 were $232 million, a decrease of 21% compared to the fourth quarter of 2018. Non-GAAP R&D expenses were $237 million, or 5.3% of quarterly revenues, in the fourth quarter of 2019, compared to $289 million, or 6.5% of quarterly revenues, in the fourth quarter of 2018. The decrease in R&D expenses in the fourth quarter of 2019 resulted primarily from pipeline optimization and efficiencies realized as part of our restructuring plan.
GAAP Selling and Marketing (S&M) expenses in the fourth quarter of 2019 were $706 million, a decrease of 11% compared to the fourth quarter of 2018. Non-GAAP S&M expenses were $665 million, or 14.9% of quarterly revenues in the fourth quarter of 2019, compared to $768 million, or 17.4% of quarterly revenues in the fourth quarter of 2018. The decrease in S&M expenses in 2019 was mainly due to cost reduction and efficiency measures as part of the restructuring plan.
GAAP General and Administrative (G&A) expenses in the fourth quarter of 2019 were $318 million, a decrease of 7% compared to the fourth quarter of 2018. Non-GAAP G&A expenses were $309 million in the fourth quarter of 2019, or 6.9% of quarterly revenues in the fourth quarter of 2019, compared to $330 million, or 7.5% of quarterly revenues in the fourth quarter of 2018. The decrease was mainly due to cost reduction and efficiency measures as part of the restructuring plan.
GAAP other income in the fourth quarter of 2019 was $47 million, compared to other loss of $43 million in the fourth quarter of 2018. Non-GAAP other income in the fourth quarter of 2019 was $9 million, compared to $5 million in fourth quarter of 2018.
GAAP operating income in the fourth quarter of 2019 was $148 million, compared to a loss of $3,164 million in the fourth quarter of 2018. Non-GAAP operating income in the fourth quarter of 2019 was $1,061 million, an increase of 12% compared to the fourth quarter of 2018. Non-GAAP operating margin was 23.8% in the fourth quarter of 2019 compared to 21.4% in the fourth quarter of 2018.
EBITDA (non-GAAP operating income, which excludes amortization and certain other items, as well as depreciation expenses) was $1,204 million in the fourth quarter of 2019, an increase of 10% compared to $1,091 million in the fourth quarter of 2018.
GAAP financial expenses for the fourth quarter of 2019 were $186, compared to $223 million in the fourth quarter of 2018. Non-GAAP financial expenses were $198 million in the fourth quarter of 2019, compared to $216 million in the fourth quarter of 2018.
In the fourth quarter of 2019, we recognized a GAAP tax benefit of $119 million on a pre-tax GAAP loss of $38 million. In the fourth quarter of 2018, we recognized a GAAP tax benefit of $139 million on a pre-tax GAAP loss of $3,387 million. Non-GAAP income taxes for the fourth quarter of 2019 were $155 million, or 18%, on pre-tax non-GAAP income of $863 million. Non-GAAP income taxes in the fourth quarter of 2018 were $96 million, or 13%, on pre-tax non-GAAP income of $730 million.
GAAP net income attributable to ordinary shareholders and GAAP diluted earnings per share in the fourth quarter of 2019 were $110 million and $0.10, respectively, compared to GAAP net loss attributable to ordinary shareholders and GAAP diluted loss per share of $2,940 million and $2.85, respectively, in the fourth quarter of 2018. Non-GAAP net income attributable to ordinary shareholders and non-GAAP diluted EPS in the fourth quarter of 2019 were $683 million and $0.62, respectively, compared to $543 million and $0.53, respectively, in the fourth quarter of 2018.
For the fourth quarter of 2019, the weighted average outstanding shares for the fully diluted EPS calculation on a GAAP basis was 1,094 million shares, compared to 1,031 million shares in the fourth quarter of 2018. The weighted average outstanding shares for the fully diluted EPS calculation on a non-GAAP basis was 1,094 million shares in the fourth quarter of 2019, compared to 1,034 million shares in the fourth quarter of 2018.
Non-GAAP information: Net non-GAAP adjustments in the fourth quarter of 2019 were $573 million. Non-GAAP net income and non-GAAP EPS for the fourth quarter were adjusted to exclude the following items:
- An impairment of intangible and fixed assets of $477 million mainly related to the acquisition of Actavis Generics;
- Amortization of purchased intangible assets totaling $290 million, of which $256 million is included in cost of goods sold and the remaining $34 million in selling and marketing expenses;
- Restructuring expenses of $59 million;
- Contingent consideration of $55 million;
- Equity compensation expenses of $19 million;
- Other non-GAAP items of $1 million;
- Minority interest adjustment of $54 million; and
- Related tax effect of $274 million.
Teva believes that excluding such items facilitates investors' understanding of its business. See the attached tables for a reconciliation of the GAAP results to the adjusted non-GAAP figures. Investors should consider non-GAAP financial measures in addition to, and not as replacement for, or superior to, measures of financial performance prepared in accordance with GAAP.
Cash flow generated from operations during the fourth quarter of 2019 was $538 million, compared to $367 million in the fourth quarter of 2018. The increase was mainly due to active management of inventory levels.
Free cash flow (Cash flow generated from operating activities, net of cash used for capital investments and beneficial interest collected in exchange for securitized trade receivables) was $974 million in the fourth quarter of 2019, compared to $522 million in the fourth quarter of 2018. The increase in 2019 resulted mainly from the higher cash flow generated from operating activities and sell of real-estate assets.
Segment Results for the Fourth Quarter of 2019
North America Segment
Our North America segment includes the United States and Canada.
The following table presents revenues, expenses and profit for our North America segment for the three months ended December 31, 2019 and 2018:
|
|
|||||||||||
|
Three months ended December 31, |
|||||||||||
|
2019 |
2018 |
||||||||||
|
(U.S. $ in millions / % of Segment Revenues) |
|||||||||||
Revenues |
$ |
2,373 |
|
100% |
$ |
2,238 |
|
100.0% |
||||
Gross profit |
|
1,196 |
|
50.4% |
|
1,201 |
|
53.7% |
||||
R&D expenses |
|
155 |
|
6.5% |
|
185 |
|
8.3% |
||||
S&M expenses |
|
265 |
|
11.2% |
|
341 |
|
15.2% |
||||
G&A expenses |
|
97 |
|
4.1% |
|
127 |
|
5.7% |
||||
Other (income) expense |
|
(7 |
) |
§ |
|
(3 |
) |
§ |
||||
Segment profit* |
$ |
686 |
|
28.9% |
$ |
551 |
|
24.6% |
||||
|
|
|
|
|
|
|
||||||
* Segment profit does not include amortization and certain other items. § Represents an amount less than 0.5%. |
||||||||||||
Revenues from our North America segment in the fourth quarter of 2019 were $2,373 million, an increase of $135 million, or 6%, compared to the fourth quarter of 2018, mainly due to the launch of TRUXIMA (a biosimilar to Rituxan®), higher revenues from respiratory products, AUSTEDO and Anda, partially offset by lower revenues from COPAXONE.
Revenues in the United States, our largest market, were $2,218 million in the fourth quarter of 2019, an increase of $116 million, or 6%, compared to the fourth quarter of 2018.
Revenues by Major Products and Activities
The following table presents revenues for our North America segment by major products and activities for the three months ended December 31, 2019 and 2018:
North America |
|
Three months ended December 31, |
|
Percentage Change |
||||
|
|
2019 |
|
2018 |
|
2019-2018 |
||
|
|
(U.S. $ in millions) |
|
|
||||
|
|
|
|
|
|
|
|
|
Generic products |
|
$ |
1,137 |
|
$ |
1,099 |
|
3% |
COPAXONE |
|
|
264 |
|
|
356 |
|
(26%) |
BENDEKA/TREANDA |
|
|
125 |
|
|
140 |
|
(11%) |
ProAir* |
|
|
80 |
|
|
45 |
|
77% |
QVAR |
|
|
67 |
|
|
9 |
|
604% |
AJOVY |
|
|
25 |
|
|
3 |
|
NA |
AUSTEDO |
|
|
136 |
|
|
68 |
|
98% |
Anda |
|
|
412 |
|
|
363 |
|
13% |
Other |
|
|
128 |
|
|
153 |
|
(16%) |
Total |
|
$ |
2,373 |
|
$ |
2,238 |
|
6% |
_________ |
|
|
|
|
|
|
|
|
* Does not include revenues from the ProAir authorized generic, which are included under generic products. |
||||||||
Generic products revenues in our North America segment in the fourth quarter of 2019 increased by 3% to $1,137 million, compared to the fourth quarter of 2018, mainly due to new generic product launches, including the launch of TRUXIMA in November 2019, partially offset by price and volume erosion due to additional competition to our product portfolio.
In the fourth quarter of 2019, we led the U.S. generics market in total prescriptions and new prescriptions, with approximately 388 million total prescriptions (based on trailing twelve months), representing 10.5% of total U.S. generic prescriptions according to IQVIA data.
COPAXONE revenues in our North America segment in the fourth quarter of 2019 decreased by 26% to $264 million, compared to the fourth quarter of 2018, mainly due to generic competition in the United States.
BENDEKA and TREANDA combined revenues in our North America segment in the fourth quarter of 2019 decreased by 11% to $125 million, compared to the fourth quarter of 2018, mainly due to lower volumes resulting from Eagle Pharmaceuticals, Inc.’s launch of a ready-to-dilute bendamustine hydrochloride in June 2018.
ProAir revenues in our North America segment in the fourth quarter of 2019 increased by 77% to $80 million, compared to the fourth quarter of 2018, mainly due to higher sales reserves recorded in the fourth quarter of 2018 in anticipation of generic competition to the short-acting beta-agonist class of drugs. We launched our own ProAir authorized generic in the United States in January 2019.
QVAR revenues in our North America segment in the fourth quarter of 2019 increased to $67 million, compared to the fourth quarter of 2018. The increase in sales was mainly due to a higher net price and an increase in volume.
AJOVY revenues in our North America segment in the fourth quarter of 2019 were $25 million. AJOVY’s exit market share in the United Stated in terms of total number of prescriptions during 2019 was 17%. On January 28, 2020, the FDA approved an auto-injector device for AJOVY in the U.S.
AUSTEDO revenues in our North America segment in the fourth quarter of 2019 were $136 million, compared to $68 million in the fourth quarter of 2018. This increase was mainly due to higher volumes.
Anda revenues in our North America segment in the fourth quarter of 2019 increased by 13% to $412 million, compared to the fourth quarter of 2018, mainly due to higher volumes.
North America Gross Profit
Gross profit from our North America segment in the fourth quarter of 2019 was $1,196 million, flat compared to the fourth quarter of 2018. Gross profit in the fourth quarter of 2019 was mainly impacted by lower revenues from COPAXONE, offset by higher revenues from AUSTEDO, the launch of TRUXIMA and higher revenues from other specialty products.
Gross profit margin for our North America segment in the fourth quarter of 2019 decreased to 50.4%, compared to 53.7% in the fourth quarter of 2018. This decrease was mainly due to lower COPAXONE revenues.
North America Profit
Profit from our North America segment in the fourth quarter of 2019 was $686 million, an increase of 24% compared to $551 million in the fourth quarter of 2018. Profit increased mainly due to higher revenues from AUSTEDO, the launch of TRUXIMA, higher revenues from other specialty products and cost reductions and efficiency measures, partially offset by lower revenues from COPAXONE.
Europe Segment
Our Europe segment includes the European Union and certain other European countries.
The following table presents revenues, expenses and profit for our Europe segment for the three months ended December 31, 2019 and 2018:
|
Three months ended December 31, |
|||||||||
|
2019 |
2018 |
||||||||
|
(U.S. $ in millions / % of Segment Revenues) |
|||||||||
Revenues |
$ |
1,184 |
100% |
$ |
1,204 |
100% |
||||
Gross profit |
|
638 |
53.9% |
|
689 |
57.2% |
||||
R&D expenses |
|
63 |
5.3% |
|
75 |
6.2% |
||||
S&M expenses |
|
253 |
21.3% |
|
278 |
23.1% |
||||
G&A expenses |
|
65 |
5.5% |
|
82 |
6.8% |
||||
Other (income) expense |
|
- |
§ |
|
1 |
§ |
||||
Segment profit* |
$ |
258 |
21.8% |
$ |
253 |
21.0% |
||||
___________ |
|
|
|
|
|
|
||||
* Segment profit does not include amortization and certain other items. § Represents an amount less than 0.5%. |
||||||||||
Revenues from our Europe segment in the fourth quarter of 2019 were $1,184 million, a decrease of $20 million, or 2%, compared to the fourth quarter of 2018. In local currency terms, revenues increased by 2%, mainly due to new generic product launches partially offset by a decline in COPAXONE revenues due to the entry of competing glatiramer acetate products and the loss of exclusivity for certain products in our oncology portfolio.
Revenues by Major Products and Activities
The following table presents revenues for our Europe segment by major products and activities for the three months ended December 31, 2019 and 2018:
Europe |
|
Three months ended December 31, |
|
Percentage Change |
||||
|
|
2019 |
|
2018 |
|
2018-2019 |
||
|
|
(U.S. $ in millions) |
|
|
||||
Generic products |
|
$ |
871 |
|
$ |
844 |
|
3% |
COPAXONE |
|
|
106 |
|
|
118 |
|
(10%) |
Respiratory products |
|
|
86 |
|
|
90 |
|
(4%) |
Other |
|
|
122 |
|
|
152 |
|
(20%) |
Total |
|
$ |
1,184 |
|
$ |
1,204 |
|
(2%) |
Generic products revenues in our Europe segment in the fourth quarter of 2019, including OTC products, increased by 3% to $871 million, compared to the fourth quarter of 2018. In local currency terms, revenues increased by 7%, mainly due to new generic product launches.
COPAXONE revenues in our Europe segment in the fourth quarter of 2019 decreased by 10% to $106 million, compared to the fourth quarter of 2018. In local currency terms, revenues decreased by 8%, mainly due to price reductions resulting from the entry of competing glatiramer acetate products.
Respiratory products revenues in our Europe segment in the fourth quarter of 2019 decreased by 4% to $86 million, compared to the fourth quarter of 2018. In local currency terms, revenues decreased by 2%, mainly due to lower sales in the United Kingdom.
Europe Gross Profit
Gross profit from our Europe segment in the fourth quarter of 2019 was $638 million, a decrease of 7% compared to $689 million in the fourth quarter of 2018. The decrease was mainly due to lower revenues from COPAXONE, the impact of currency fluctuations and higher cost of goods sold, partially offset by new generic product launches.
Gross profit margin for our Europe segment in the fourth quarter of 2019 decreased to 53.9%, compared to 57.2% in the fourth quarter of 2018. This decrease was mainly due to higher cost of goods sold and product mix.
Europe Profit
Profit from our Europe segment in the fourth quarter of 2019 was $258 million, an increase of 2% compared to $253 million in the fourth quarter of 2018. This increase was mainly due to cost reductions and efficiency measures as part of the restructuring plan.
International Markets Segment
Our International Markets segment includes all countries other than those in our North America and Europe segments. The key markets in this segment are Japan, Russia and Israel.
The following table presents revenues, expenses and profit for our International Markets segment for the three months ended December 31, 2019 and 2018:
|
Three months ended December 31, |
|||||||||
|
2019 |
2018 |
||||||||
|
(U.S. $ in millions / % of Segment Revenues) |
|||||||||
Revenues |
$ |
578 |
100% |
$ |
599 |
100% |
||||
Gross profit |
|
290 |
50.1% |
|
312 |
52.1% |
||||
R&D expenses |
|
21 |
3.7% |
|
26 |
4.3% |
||||
S&M expenses |
|
133 |
23.0% |
|
134 |
22.4% |
||||
G&A expenses |
|
36 |
6.2% |
|
38 |
6.3% |
||||
Other (income) expense |
|
(1) |
§ |
|
- |
§ |
||||
Segment profit* |
$ |
101 |
17.5% |
$ |
114 |
19.0% |
||||
__________ |
* Segment profit does not include amortization and certain other items. § Represents an amount less than 0.5%. The data presented for prior periods have been revised to reflect a revision in the presentation of net revenues and cost of sales in the consolidated financial statements. See "Revision of Previously Reported Consolidated Financial Statements" above. |
Revenues from our International Markets segment in the fourth quarter of 2019 were $578 million, a decrease of $21 million, or 3%, compared to the fourth quarter of 2018. In local currency terms, revenues decreased by 3% compared to the fourth quarter of 2018, mainly due to lower sales in Japan and Israel.
Revenues by Major Products and Activities
The following table presents revenues for our International Markets segment by major products and activities for the three months ended December 31, 2019 and 2018:
|
|
|
|
|
||||
International markets |
|
Three months ended December 31, |
|
Percentage Change |
||||
|
|
2019 |
|
2018 |
|
2018-2019 |
||
|
|
(U.S. $ in millions) |
|
|
||||
Generic products |
|
$ |
489 |
|
$ |
499 |
|
(2%) |
COPAXONE |
|
|
17 |
|
|
20 |
|
(14%) |
Distribution* |
|
|
6 |
|
|
5 |
|
11% |
Other |
|
|
67 |
|
|
76 |
|
(12%) |
Total |
|
$ |
578 |
|
$ |
599 |
|
(3%) |
*The data presented for prior periods have been revised to reflect a revision in the presentation of net revenues and cost of sales in the consolidated financial statements. See "Revision of Previously Reported Consolidated Financial Statements" above. |
Generic products revenues in our International Markets segment, which include OTC products, decreased by 2% to $489 million in the fourth quarter of 2019, compared to the fourth quarter of 2018. In local currency terms, revenues decreased by 3%, mainly due to lower sales in Japan resulting from regulatory pricing reductions and generic competition to off-patented products.
COPAXONE revenues in our International Markets segment in the fourth quarter of 2019 decreased by 14% to $17 million, compared to the fourth quarter of 2018. In local currency terms, revenues decreased by 8%.
Distribution revenues in our International Markets segment in the fourth quarter of 2019 increased by 11% to $6 million, compared to the fourth quarter of 2018. In local currency terms, revenues increased by 3%.
International Markets Gross Profit
Gross profit from our International Markets segment in the fourth quarter of 2019 was $290 million, a decrease of 7% compared to $312 million in the fourth quarter of 2018. Gross profit margin for our International Markets segment in the fourth quarter of 2019 decreased to 50.1%, compared to 52.1% in the fourth quarter of 2018. The decrease was mainly due to lower gross profit resulting from changes in the product mix in certain countries, mainly Japan.
International Markets Profit
Profit from our International Markets segment in the fourth quarter of 2019 was $101 million, compared to $114 million in the fourth quarter of 2018. The decrease was mainly due to lower revenues in Japan, partially offset by cost reductions and efficiency measures as part of the restructuring plan.
Other Activities
We have other sources of revenues, primarily the sale of APIs to third parties, certain contract manufacturing services and an out-licensing platform offering a portfolio of products to other pharmaceutical companies through our affiliate Medis. Our other activities are not included in our North America, Europe or International Markets segments.
Our revenues from other activities in the fourth quarter of 2019 decreased by 12% to $332 million, compared to the fourth quarter of 2018. In local currency terms, revenues decreased by 11%.
API sales to third parties in the fourth quarter of 2019 were $187 million, a decrease of 10% compared to the fourth quarter of 2018, in both U.S. dollars and local currency terms.
Outlook for 2020 Non-GAAP Results |
||||||
|
2019 Actuals |
2020 Outlook |
||||
Revenues |
$16.9 billion |
$16.6 - $17.0 billion |
||||
Non-GAAP Operating Income |
$4.1 billion |
$4.0 - $4.4 billion |
||||
EBITDA |
$4.7 billion |
$4.5 - $4.9 billion |
||||
Non-GAAP EPS |
$2.40 |
$2.30 - $2.55 |
||||
Weighted average number of shares |
1,094 million |
1,098 million |
||||
Free cash flow |
$2.1 billion |
$1.8 - $2.2 billion |
||||
The outlook for 2020 non-GAAP results is based on the following key assumptions:
|
2019 Actuals |
Commentary |
||||
Global COPAXONE |
$1.5 billion |
Continued generic erosion; sales of approximately $1.2 billion |
||||
AUSTEDO |
$412 million |
Continued increase in the U.S. sales to approximately $650 million |
||||
Global AJOVY |
$96 million |
Continued increase in sales to approximately $250 million |
||||
Foreign Exchange |
|
Moderate negative impact on revenues and operating income compared to 2019 |
||||
Tax Rate |
18% |
17% - 18% |
||||
CAPEX |
$0.5 billion |
$0.6 billion |
Conference Call
Teva will host a conference call and live webcast along with a slide presentation on Wednesday, February 12, 2020 at 8:00 a.m. ET to discuss its fourth quarter and annual 2019 results and overall business environment. A question & answer session will follow.
United States |
1-866-966-1396 |
||||
International |
+44 (0) 2071 928000 |
||||
Israel |
1-809-203-624 |
For a list of other international toll-free numbers, click here.
Passcode: 1459117
A live webcast of the call will also be available on Teva's website at: ir.tevapharm.com. Please log in at least 10 minutes prior to the conference call in order to download the applicable software.
Following the conclusion of the call, a replay of the webcast will be available within 24 hours on the Company's website by calling United States 1-866-331-1332; International +44 (0) 3333 009785; passcode: 1459117.
About Teva
Teva Pharmaceutical Industries Ltd. (NYSE and TASE: TEVA) has been developing and producing medicines to improve people’s lives for more than a century. We are a global leader in generic and specialty medicines with a portfolio consisting of over 3,500 products in nearly every therapeutic area. Around 200 million people around the world take a Teva medicine every day, and are served by one of the largest and most complex supply chains in the pharmaceutical industry. Along with our established presence in generics, we have significant innovative research and operations supporting our growing portfolio of specialty and biopharmaceutical products. Learn more at www.tevapharm.com.
Non-GAAP Financial Measures
This press release contains certain financial information that differs from what is reported under accounting principles generally accepted in the United States ("GAAP"). These non-GAAP financial measures, including, but not limited to, revenues prior to revision, non-GAAP EPS, non-GAAP operating income, non-GAAP gross profit, non-GAAP gross profit margin, EBITDA, non-GAAP financial expenses, non-GAAP income taxes, non-GAAP net income and non-GAAP diluted EPS are presented in order to facilitates investors' understanding of our business. We utilize certain non-GAAP financial measures to evaluate performance, in conjunction with other performance metrics. The following are examples of how we utilize the non-GAAP measures: our management and board of directors use the non-GAAP measures to evaluate our operational performance, to compare against work plans and budgets, and ultimately to evaluate the performance of management; our annual budgets are prepared on a non-GAAP basis; and senior management’s annual compensation is derived, in part, using these non-GAAP measures. Revenues prior to revision are being presented to provide investors with comparable information to that which was provided in prior periods. The revision of gross to net presentation of revenues in the distribution business in our International Markets segment decreased revenues with an offsetting decrease in cost of sales. See the attached tables for a reconciliation of the GAAP results to the adjusted non-GAAP figures. Investors should consider non-GAAP financial measures in addition to, and not as replacements for, or superior to, measures of financial performance prepared in accordance with GAAP. We are not providing forward looking guidance for GAAP reported financial measures or a quantitative reconciliation of forward-looking non-GAAP financial measures to the most directly comparable GAAP measure because we are unable to predict with reasonable certainty the ultimate outcome of certain significant items without unreasonable effort.
CAUTIONARY NOTE REGARDING FORWARD-LOOKING STATEMENTS
This press release contains forward-looking statements within the meaning of the Private Securities Litigation Reform Act of 1995, which are based on management’s current beliefs and expectations and are subject to substantial risks and uncertainties, both known and unknown, that could cause our future results, performance or achievements to differ significantly from that expressed or implied by such forward-looking statements. Important factors that could cause or contribute to such differences include risks relating to:
- our ability to successfully compete in the marketplace, including: that we are substantially dependent on our generic products; consolidation of our customer base and commercial alliances among our customers; the increase in the number of competitors targeting generic opportunities and seeking U.S. market exclusivity for generic versions of significant products; competition for our specialty products, especially COPAXONE®, our leading medicine, which faces competition from existing and potential additional generic versions, competing glatiramer acetate products and orally-administered alternatives; the uncertainty of commercial success of AJOVY® or AUSTEDO®; competition from companies with greater resources and capabilities; delays in launches of new products and our ability to achieve expected results from investments in our product pipeline; ability to develop and commercialize biopharmaceutical products; efforts of pharmaceutical companies to limit the use of generics, including through legislation and regulations and the effectiveness of our patents and other measures to protect our intellectual property rights;
- our substantial indebtedness, which may limit our ability to incur additional indebtedness, engage in additional transactions or make new investments, may result in a further downgrade of our credit ratings; and our inability to raise debt or borrow funds in amounts or on terms that are favorable to us;
- our business and operations in general, including: implementation of our restructuring plan announced in December 2017; our ability to attract, hire and retain highly skilled personnel; our ability to develop and commercialize additional pharmaceutical products; compliance with anti-corruption, sanctions and trade control laws; manufacturing or quality control problems; interruptions in our supply chain; disruptions of information technology systems; breaches of our data security; variations in intellectual property laws; challenges associated with conducting business globally, including adverse effects of political or economic instability, major hostilities or terrorism; significant sales to a limited number of customers; our ability to successfully bid for suitable acquisition targets or licensing opportunities, or to consummate and integrate acquisitions; our prospects and opportunities for growth if we sell assets and potential difficulties related to the operation of our new global enterprise resource planning (ERP) system;
- compliance, regulatory and litigation matters, including: increased legal and regulatory action in connection with public concern over the abuse of opioid medications in the U.S. and our ability to reach a final resolution of the remaining opioid-related litigation; costs and delays resulting from the extensive governmental regulation to which we are subject; the effects of reforms in healthcare regulation and reductions in pharmaceutical pricing, reimbursement and coverage; governmental investigations into S&M practices; potential liability for patent infringement; product liability claims; increased government scrutiny of our patent settlement agreements; failure to comply with complex Medicare and Medicaid reporting and payment obligations; and environmental risks;
- other financial and economic risks, including: our exposure to currency fluctuations and restrictions as well as credit risks; potential impairments of our intangible assets; potential significant increases in tax liabilities; and the effect on our overall effective tax rate of the termination or expiration of governmental programs or tax benefits, or of a change in our business;
and other factors discussed in our Annual Report on Form 10-K and subsequently filed reports, including the sections captioned "Risk Factors." Forward-looking statements speak only as of the date on which they are made, and we assume no obligation to update or revise any forward-looking statements or other information contained herein, whether as a result of new information, future events or otherwise. You are cautioned not to put undue reliance on these forward-looking statements.
| Consolidated Statements of Income | ||||||||
| (U.S. dollars in millions, except share and per share data) | ||||||||
| Three months ended | Year ended | |||||||
| December 31, | December 31, | |||||||
2019 |
2018 |
2019 |
2018 |
|||||
| (Unaudited) | (Unaudited) | (Audited) | (Audited) | |||||
| Net revenues | 4,468 |
4,418 |
16,887 |
18,271 |
||||
| Cost of sales | 2,510 |
2,447 |
9,351 |
9,975 |
||||
| Gross profit | 1,958 |
1,971 |
7,537 |
8,296 |
||||
| Research and development expenses | 232 |
295 |
1,010 |
1,213 |
||||
| Selling and marketing expenses | 706 |
797 |
2,614 |
2,916 |
||||
| General and administrative expenses | 318 |
344 |
1,192 |
1,298 |
||||
| Other asset impairments, restructuring and other items | 161 |
153 |
423 |
987 |
||||
| Intangible assets impairment | 433 |
745 |
1,639 |
1,991 |
||||
| Goodwill impairment | - |
2,727 |
- |
3,027 |
||||
| Legal settlements and loss contingencies | 7 |
31 |
1,178 |
(1,208) |
||||
| Other expense (income) | (47) |
43 |
(76) |
(291) |
||||
| Operating income (loss) | 148 |
(3,164) |
(443) |
(1,637) |
||||
| Financial expenses – net | 186 |
223 |
822 |
959 |
||||
| Loss before income taxes | (38) |
(3,387) |
(1,265) |
(2,596) |
||||
| Tax benefits | (119) |
(139) |
(278) |
(195) |
||||
| Share in losses (profit) of associated companies, net | 5 |
(5) |
13 |
71 |
||||
| Net income (loss) | 75 |
(3,243) |
(1,000) |
(2,472) |
||||
| Net income attributable to non-controlling interests | (34) |
(357) |
(2) |
(322) |
||||
| Net income (loss) attributable to Teva | 110 |
(2,886) |
(999) |
(2,150) |
||||
| Dividends on preferred shares | - |
54 |
- |
249 |
||||
| Net loss attributable to Teva's ordinary shareholders | 110 |
(2,940) |
(999) |
(2,399) |
||||
| Earnings per share attributable to ordinary shareholders: | Basic ($) | 0.10 |
(2.85) |
(0.91) |
(2.35) |
|||
| Diluted ($) | 0.10 |
(2.85) |
(0.91) |
(2.35) |
||||
| Weighted average number of shares (in millions): | Basic | 1,092 |
1,031 |
1,091 |
1,021 |
|||
| Diluted | 1,094 |
1,031 |
1,091 |
1,021 |
||||
| Non-GAAP net income attributable to ordinary shareholders:* | 683 |
543 |
2,627 |
2,985 |
||||
| Non-GAAP net income attributable to ordinary shareholders for diluted earnings per share: | 683 |
543 |
2,627 |
2,985 |
||||
| Non-GAAP earnings per share attributable to ordinary shareholders:* | Basic ($) | 0.63 |
0.53 |
2.41 |
2.92 |
|||
| Diluted ($) | 0.62 |
0.53 |
2.40 |
2.92 |
||||
| Non-GAAP average number of shares (in millions): | Basic | 1,092 |
1,031 |
1,091 |
1,021 |
|||
| Diluted | 1,094 |
1,034 |
1,094 |
1,024 |
||||
| * See reconciliation attached. | ||||||||
| Condensed Consolidated Balance Sheets | ||||
| (U.S. dollars in millions) | ||||
| (Audited) | ||||
| December 31, | December 31, | |||
2019 |
2018 |
|||
| ASSETS | ||||
| Current assets: | ||||
| Cash and cash equivalents | 1,975 |
1,782 |
||
| Trade receivables | 5,676 |
5,822 |
||
| Inventories | 4,422 |
4,731 |
||
| Prepaid expenses | 870 |
899 |
||
| Other current assets | 434 |
468 |
||
| Assets held for sale | 87 |
92 |
||
| Total current assets | 13,464 |
13,794 |
||
| Deferred income taxes | 386 |
368 |
||
| Other non-current assets | 591 |
731 |
||
| Property, plant and equipment, net | 6,436 |
6,868 |
||
| Operating lease right-of-use assets | 514 |
- |
||
| Identifiable intangible assets, net | 11,232 |
14,005 |
||
| Goodwill | 24,846 |
24,917 |
||
| Total assets | 57,470 |
60,683 |
||
| LIABILITIES & EQUITY | ||||
| Current liabilities: | ||||
| Short-term debt | 2,345 |
2,216 |
||
| Sales reserves and allowances | 6,159 |
6,711 |
||
| Trade payables | 1,718 |
1,853 |
||
| Employee-related obligations | 693 |
870 |
||
| Accrued expenses | 1,869 |
1,868 |
||
| Other current liabilities | 889 |
804 |
||
| Total current liabilities | 13,674 |
14,322 |
||
| Long-term liabilities: | ||||
| Deferred income taxes | 1,096 |
2,140 |
||
| Other taxes and long-term liabilities | 2,640 |
1,727 |
||
| Senior notes and loans | 24,562 |
26,700 |
||
| Operating lease liabilities | 435 |
- |
||
| Total long-term liabilities | 28,733 |
30,567 |
||
| Equity: | ||||
| Teva shareholders’ equity | 13,972 |
14,707 |
||
| Non-controlling interests | 1,091 |
1,087 |
||
| Total equity | 15,063 |
15,794 |
||
| Total liabilities and equity | 57,470 |
60,683 |
||
| TEVA PHARMACEUTICAL INDUSTRIES LIMITED | ||||||||||||||||
| CONSOLIDATED STATEMENTS OF CASH FLOWS | ||||||||||||||||
| (U.S. dollars in millions) | ||||||||||||||||
| (Unaudited) | ||||||||||||||||
| Year ended | Three months ended |
|||||||||||||||
| December 31, | December 31, | |||||||||||||||
2019 |
2018 |
2019 |
2018 |
|||||||||||||
| Operating activities: | ||||||||||||||||
| Net income (loss) | (1,000 |
) |
$ |
(2,472 |
) |
$ |
76 |
|
$ |
(3,243 |
) |
|||||
| Adjustments to reconcile net income (loss) to net cash provided by operations: | ||||||||||||||||
| Impairment of long-lived assets | 1,778 |
|
5,621 |
|
476 |
|
3,717 |
|
||||||||
| Depreciation and amortization | 1,722 |
|
1,842 |
|
416 |
|
382 |
|
||||||||
| Net change in operating assets and liabilities | (896 |
) |
(1,823 |
) |
(112 |
) |
(302 |
) |
||||||||
| Deferred income taxes — net and uncertain tax positions | (985 |
) |
(837 |
) |
(333 |
) |
(187 |
) |
||||||||
| Stock-based compensation | 119 |
|
155 |
|
20 |
|
33 |
|
||||||||
| Other items | 28 |
|
(135 |
) |
23 |
|
(127 |
) |
||||||||
| Research and development in process | - |
|
114 |
|
- |
|
60 |
|
||||||||
| Net income (loss) from sale of long-lived assets and investments | (18 |
) |
(19 |
) |
(28 |
) |
34 |
|
||||||||
| Net cash provided by operating activities | 748 |
|
2,446 |
|
538 |
|
367 |
|
||||||||
| Investing activities: | ||||||||||||||||
| Beneficial interest collected in exchange for securitized trade receivables | 1,487 |
|
1,735 |
|
379 |
|
363 |
|
||||||||
| Proceeds from sales of long-lived assets and investments | 343 |
|
890 |
|
174 |
|
10 |
|
||||||||
| Purchases of property, plant and equipment | (525 |
) |
(651 |
) |
(119 |
) |
(213 |
) |
||||||||
| Purchases of investments and other assets | (8 |
) |
(119 |
) |
(3 |
) |
(63 |
) |
||||||||
| Other investing activities | 58 |
|
11 |
|
(1 |
) |
(23 |
) |
||||||||
| Net cash provided by investing activities | 1,355 |
|
1,866 |
|
430 |
|
74 |
|
||||||||
| Financing activities: | ||||||||||||||||
| Repayment of senior notes and loans and other long-term liabilities | (3,944 |
) |
(7,446 |
) |
(2,229 |
) |
(457 |
) |
||||||||
| Proceeds from senior notes and loans, net of issuance costs | 2,083 |
|
4,434 |
|
2,083 |
|
- |
|
||||||||
| Net change in short-term debt | (2 |
) |
(260 |
) |
(98 |
) |
2 |
|
||||||||
| Other financing activities | (11 |
) |
(57 |
) |
3 |
|
(44 |
) |
||||||||
| Tax withholding payments made on shares and dividends | (52 |
) |
(22 |
) |
- |
|
- |
|
||||||||
| Net cash provided by (used in) financing activities | (1,926 |
) |
(3,351 |
) |
(241 |
) |
(499 |
) |
||||||||
| Translation adjustment on cash and cash equivalents | 16 |
|
(142 |
) |
7 |
|
(35 |
) |
||||||||
| Net change in cash and cash equivalents | 193 |
|
819 |
|
734 |
|
(93 |
) |
||||||||
| Balance of cash and cash equivalents at beginning of period | 1,782 |
|
963 |
|
1,241 |
|
1,875 |
|
||||||||
| Balance of cash and cash equivalents at end of period | $ |
1,975 |
|
$ |
1,782 |
|
$ |
1,975 |
|
$ |
1,782 |
|
||||
| Three Months Ended December 31, 2019 | |||||||||||||||||||||||||||
| U.S. $ and shares in millions (except per share amounts) | |||||||||||||||||||||||||||
| GAAP | Excluded for non GAAP measurement | Non GAAP | |||||||||||||||||||||||||
| Amortization of purchased intangible assets |
Legal settlements and loss contingencies |
Impairment of long-lived assets |
Other R&D expenses |
Restructuring costs |
Costs related to regulatory actions taken in facilities |
Equity compensation |
Contingent consideration |
Gain on sale of business |
Other non GAAP items |
Other items |
|||||||||||||||||
| COGS | 2,510 |
256 |
17 |
5 |
26 |
2,206 |
|||||||||||||||||||||
| R&D | 232 |
(8) |
4 |
- |
237 |
||||||||||||||||||||||
| S&M | 706 |
34 |
6 |
1 |
665 |
||||||||||||||||||||||
| G&A | 318 |
5 |
5 |
309 |
|||||||||||||||||||||||
| Other income | (47) |
(38) |
(9) |
||||||||||||||||||||||||
| Legal settlements and loss contingencies | 7 |
7 |
- |
||||||||||||||||||||||||
| Other asset impairments, restructuring and other items | 161 |
44 |
59 |
55 |
2 |
- |
|||||||||||||||||||||
| Intangible assets impairment | 433 |
433 |
- |
||||||||||||||||||||||||
| Financial expenses | 186 |
(11) |
198 |
||||||||||||||||||||||||
| Corresponding tax effect | (119) |
(274) |
155 |
||||||||||||||||||||||||
| Share in losses of associated companies – net | 5 |
- |
5 |
||||||||||||||||||||||||
| Net income attributable to non-controlling interests | (34) |
(54) |
19 |
||||||||||||||||||||||||
| Total reconciled items | 290 |
7 |
477 |
(8) |
59 |
17 |
19 |
55 |
(38) |
34 |
(339) |
||||||||||||||||
| EPS - Basic | 0.10 |
0.52 |
0.63 |
||||||||||||||||||||||||
| EPS - Diluted | 0.10 |
0.52 |
0.62 |
||||||||||||||||||||||||
The non-GAAP diluted weighted average number of shares was 1,094 million for the three months ended December 31, 2019. |
|||||||||||||||||||||||||||
| Three Months Ended December 31, 2018 | |||||||||||||||||||||||||||||||
| U.S. $ and shares in millions (except per share amounts) | |||||||||||||||||||||||||||||||
| GAAP | Excluded for non GAAP measurement | Non GAAP | |||||||||||||||||||||||||||||
| Amortization of purchased intangible assets |
Legal settlements and loss contingencies |
Goodwill impairment |
Impairment of long-lived assets |
Other R&D expenses |
Acquisition, integration and related expenses |
Restructuring costs |
Costs related to regulatory actions taken in facilities |
Equity compensation |
Contingent consideration |
Gain on sale of business |
Other non GAAP items |
Other items |
|||||||||||||||||||
| COGS | 2,447 |
233 |
8 |
6 |
110 |
2,090 |
|||||||||||||||||||||||||
| R&D | 295 |
1 |
5 |
- |
289 |
||||||||||||||||||||||||||
| S&M | 797 |
24 |
8 |
(3) |
768 |
||||||||||||||||||||||||||
| G&A | 344 |
11 |
3 |
330 |
|||||||||||||||||||||||||||
| Other income | 43 |
48 |
(5) |
||||||||||||||||||||||||||||
| Legal settlements and loss contingencies | 31 |
31 |
- |
||||||||||||||||||||||||||||
| Other asset impairments, restructuring and other items | 153 |
245 |
4 |
46 |
(27) |
(115) |
- |
||||||||||||||||||||||||
| Intangible assets impairment | 745 |
745 |
- |
||||||||||||||||||||||||||||
| Goodwill impairment | 2,727 |
2,727 |
- |
||||||||||||||||||||||||||||
| Financial expenses | 223 |
7 |
216 |
||||||||||||||||||||||||||||
| Corresponding tax effect | (139) |
(235) |
96 |
||||||||||||||||||||||||||||
| Share in losses of associated companies – net | (5) |
- |
(5) |
||||||||||||||||||||||||||||
| Net income attributable to non-controlling interests | (357) |
(399) |
42 |
||||||||||||||||||||||||||||
| Total reconciled items | 257 |
31 |
2,727 |
990 |
1 |
4 |
46 |
8 |
30 |
(27) |
48 |
(5) |
(627) |
||||||||||||||||||
| EPS - Basic | (2.85) |
3.38 |
0.53 |
||||||||||||||||||||||||||||
| EPS - Diluted | (2.85) |
3.38 |
0.53 |
||||||||||||||||||||||||||||
The non-GAAP diluted weighted average number of shares was 1,034 million for the three months ended December 31, 2018. |
|||||||||||||||||||||||||||||||
| Year Ended December 31, 2019 | |||||||||||||||||||||||||||
| (U.S. $ and shares in millions, except per share amounts) | |||||||||||||||||||||||||||
| GAAP | Excluded for non GAAP measurement | Non GAAP | |||||||||||||||||||||||||
| Amortization of purchased intangible assets |
Legal settlements and loss contingencies |
Impairment of long-lived assets |
Other R&D expenses |
Restructuring costs |
Costs related to regulatory actions taken in facilities |
Equity compensation |
Contingent consideration |
Gain on sale of business |
Other non GAAP items |
Other items |
|||||||||||||||||
| COGS* | 9,351 |
973 |
45 |
26 |
121 |
8,185 |
|||||||||||||||||||||
| R&D | 1,010 |
(15) |
20 |
1 |
1,004 |
||||||||||||||||||||||
| S&M | 2,614 |
139 |
35 |
1 |
2,438 |
||||||||||||||||||||||
| G&A | 1,192 |
42 |
5 |
1,145 |
|||||||||||||||||||||||
| Other income | (76) |
(50) |
(27) |
||||||||||||||||||||||||
| Legal settlements and loss contingencies | 1,178 |
1,178 |
- |
||||||||||||||||||||||||
| Other asset impairments, restructuring and other items | 423 |
139 |
199 |
59 |
26 |
- |
|||||||||||||||||||||
| Intangible assets impairment | 1,639 |
1,639 |
- |
||||||||||||||||||||||||
| Financial expenses | 822 |
(3) |
824 |
||||||||||||||||||||||||
| Corresponding tax effect | (278) |
(875) |
597 |
||||||||||||||||||||||||
| Share in losses of associated companies – net | 13 |
- |
13 |
||||||||||||||||||||||||
| Net income attributable to non-controlling interests | (2) |
(82) |
80 |
||||||||||||||||||||||||
| Total reconciled items | 1,113 |
1,178 |
1,778 |
(15) |
199 |
45 |
123 |
59 |
(50) |
155 |
(959) |
||||||||||||||||
| EPS - Basic | (0.91) |
3.32 |
2.41 |
||||||||||||||||||||||||
| EPS - Diluted | (0.91) |
3.32 |
2.40 |
||||||||||||||||||||||||
The non-GAAP diluted weighted average number of shares was 1,094 million for the year ended December 31, 2019. |
|||||||||||||||||||||||||||
| Year ended December 31, 2018 | |||||||||||||||||||||||||||||||
| (U.S. $ and shares in millions, except per share amounts) | |||||||||||||||||||||||||||||||
| GAAP | Excluded for non GAAP measurement | Non GAAP | |||||||||||||||||||||||||||||
| Amortization of purchased intangible assets |
Goodwill impairment |
Legal settlements and loss contingencies |
Impairment of long-lived assets |
Other R&D expenses |
Acquisition integration and related expenses |
Restructuring costs |
Costs related to regulatory actions taken in facilities |
Equity compensation |
Contingent consideration |
Gain on sale of business |
Other non GAAP items |
Other items |
|||||||||||||||||||
| COGS* | 9,975 |
1,004 |
14 |
28 |
204 |
8,725 |
|||||||||||||||||||||||||
| R&D | 1,213 |
83 |
26 |
2 |
1,102 |
||||||||||||||||||||||||||
| S&M | 2,916 |
162 |
43 |
(7) |
2,718 |
||||||||||||||||||||||||||
| G&A | 1,298 |
55 |
15 |
1,228 |
|||||||||||||||||||||||||||
| Other income | (291) |
(66) |
(225) |
||||||||||||||||||||||||||||
| Legal settlements and loss contingencies | (1,208) |
(1,208) |
- |
||||||||||||||||||||||||||||
| Other asset impairments, restructuring and other items | 987 |
500 |
13 |
488 |
57 |
(71) |
- |
||||||||||||||||||||||||
| Intangible assets impairment | 1,991 |
1,991 |
- |
||||||||||||||||||||||||||||
| Goodwill impairment | 3,027 |
3,027 |
- |
||||||||||||||||||||||||||||
| Financial expenses | 959 |
66 |
893 |
||||||||||||||||||||||||||||
| Corresponding tax effect | (195) |
(714) |
519 |
||||||||||||||||||||||||||||
| Share in losses of associated companies – net | 71 |
103 |
(32) |
||||||||||||||||||||||||||||
| Net income attributable to non-controlling interests | (322) |
(431) |
109 |
||||||||||||||||||||||||||||
| Total reconciled items | 1,166 |
3,027 |
(1,208) |
2,491 |
83 |
13 |
488 |
14 |
152 |
57 |
(66) |
143 |
(976) |
||||||||||||||||||
| EPS - Basic | (2.35) |
5.27 |
2.92 |
||||||||||||||||||||||||||||
| EPS - Diluted | (2.35) |
5.27 |
2.92 |
||||||||||||||||||||||||||||
| The non-GAAP diluted weighted average number of shares was 1,024 million for the year ended December 31, 2018. | |||||||||||||||||||||||||||||||
The data presented for prior periods have been revised to reflect a revision in the presentation of net revenues and cost of sales in the consolidated financial statements. See note 1b to our consolidated financial statements for additional information. |
|||||||||||||||||||||||||||||||
| Segment Information | |||||||||||||||||
| North America | Europe | International Markets | |||||||||||||||
| Three months ended December 31, |
Three months ended December 31, |
Three months ended December 31, |
|||||||||||||||
2019 |
2018 |
2019 |
2018 |
2019 |
2018 |
||||||||||||
| (U.S. $ in millions) | (U.S. $ in millions) | (U.S. $ in millions) | |||||||||||||||
| Revenues | $ |
2,373 |
$ |
2,238 |
$ |
1,184 |
$ |
1,204 |
$ |
578 |
$ |
599 |
|||||
| Gross profit | 1,196 |
1,201 |
638 |
689 |
290 |
312 |
|||||||||||
| R&D expenses | 155 |
185 |
63 |
75 |
21 |
26 |
|||||||||||
| S&M expenses | 265 |
341 |
253 |
278 |
133 |
134 |
|||||||||||
| G&A expenses | 97 |
127 |
65 |
82 |
36 |
38 |
|||||||||||
| Other income (loss) | (7) |
(3) |
- |
1 |
(1) |
- |
|||||||||||
| Segment profit | $ |
686 |
$ |
551 |
$ |
258 |
$ |
253 |
$ |
101 |
$ |
114 |
|||||
| Segment Information | |||||||||||||||||
| North America | Europe | International Markets | |||||||||||||||
| Year ended December 31, | Year ended December 31, | Year ended December 31, | |||||||||||||||
2019 |
2018 |
2019 |
2018 |
2019 |
2018 |
||||||||||||
| (U.S. $ in millions) | (U.S. $ in millions) | (U.S. $ in millions) | |||||||||||||||
| Revenues | $ |
8,542 |
$ |
9,297 |
$ |
4,795 |
$ |
5,186 |
$ |
2,246 |
$ |
2,422 |
|||||
| Gross profit | 4,350 |
4,979 |
2,704 |
2,884 |
1,167 |
1,254 |
|||||||||||
| R&D expenses | 652 |
713 |
262 |
283 |
88 |
96 |
|||||||||||
| S&M expenses | 1,021 |
1,154 |
890 |
1,003 |
481 |
518 |
|||||||||||
| G&A expenses | 439 |
484 |
239 |
325 |
138 |
153 |
|||||||||||
| Other income | (14) |
(209) |
(5) |
- |
(3) |
(11) |
|||||||||||
| Segment profit | $ |
2,252 |
$ |
2,837 |
$ |
1,318 |
$ |
1,273 |
$ |
464 |
$ |
498 |
|||||
Reconciliation of our segment profit |
||||||||
to consolidated income before income taxes |
||||||||
|
|
|
||||||
|
|
Three months ended |
||||||
|
|
December 31, |
||||||
|
|
2019 |
|
2018 |
||||
|
|
|
|
|
|
|
||
|
|
(U.S.$ in millions) |
||||||
| North America profit | $ |
686 |
|
$ |
551 |
|
||
| Europe profit | 258 |
|
253 |
|
||||
| International Markets profit | 101 |
|
114 |
|
||||
| Total segment profit | 1,044 |
|
918 |
|
||||
| Profit (loss) of other activities | 17 |
|
28 |
|
||||
1,061 |
|
946 |
|
|||||
| Amounts not allocated to segments: | ||||||||
| Amortization | 290 |
|
257 |
|
||||
| Other asset impairments, restructuring and other items | 161 |
|
153 |
|
||||
| Goodwill impairment | - |
|
2,727 |
|
||||
| Intangible asset impairments | 433 |
|
745 |
|
||||
| Loss from divestitures, net of divestitures related costs | (38 |
) |
48 |
|
||||
| Other R&D expenses (income) | (8 |
) |
1 |
|
||||
| Costs related to regulatory actions taken in facilities | 17 |
|
8 |
|
||||
| Legal settlements and loss contingencies | 7 |
|
31 |
|
||||
| Other unallocated amounts | 51 |
|
140 |
|
||||
| Consolidated operating income (loss) | 148 |
|
(3,164 |
) |
||||
| Financial expenses - net | 186 |
|
223 |
|
||||
| Consolidated income (loss) before income taxes | $ |
(38 |
) |
$ |
(3,387 |
) |
||
Reconciliation of our segment profit |
||||||||
to consolidated income before income taxes |
||||||||
|
|
|
||||||
|
|
Year ended |
||||||
|
|
December 31, |
||||||
|
|
2019 |
|
2018 |
||||
|
|
|
|
|
|
|
||
|
|
(U.S.$ in millions) |
||||||
| North America profit | $ |
2,252 |
|
$ |
2,837 |
|
||
| Europe profit | 1,318 |
|
1,273 |
|
||||
| International Markets profit | 464 |
|
498 |
|
||||
| Total segment profit | 4,034 |
|
4,608 |
|
||||
| Profit of other activities | 108 |
|
115 |
|
||||
4,142 |
|
4,723 |
|
|||||
| Amounts not allocated to segments: | ||||||||
| Amortization | 1,113 |
|
1,166 |
|
||||
| Other asset impairments, restructuring and other items | 423 |
|
987 |
|
||||
| Goodwill impairment | - |
|
3,027 |
|
||||
| Intangible asset impairments | 1,639 |
|
1,991 |
|
||||
| Gain on divestitures, net of divestitures related costs | (50 |
) |
(66 |
) |
||||
| Other R&D expenses (income) | (15 |
) |
83 |
|
||||
| Costs related to regulatory actions taken in facilities | 45 |
|
14 |
|
||||
| Legal settlements and loss contingencies | 1,178 |
|
(1,208 |
) |
||||
| Other unallocated amounts | 252 |
|
366 |
|
||||
| Consolidated operating income (loss) | (443 |
) |
(1,637 |
) |
||||
| Financial expenses - net | 822 |
|
959 |
|
||||
| Consolidated income (loss) before income taxes | $ |
(1,265 |
) |
$ |
(2,596 |
) |
||
| Revenues by Activity and Geographical Area | ||||||||
| (Unaudited) | ||||||||
Three months ended |
|
|
||||||
December 31, |
|
Percentage Change |
||||||
2019 |
|
2018 |
|
2018-2019 |
||||
(U.S.$ in millions) |
|
|
||||||
| North America segment | ||||||||
| Generics medicines | $ |
1,137 |
$ |
1,099 |
3% |
|||
| COPAXONE | 264 |
356 |
(26%) |
|||||
| Bendeka and Trenda | 125 |
140 |
(11%) |
|||||
| ProAir | 80 |
45 |
77% |
|||||
| QVAR | 67 |
9 |
604% |
|||||
| AJOVY | 25 |
3 |
NA |
|||||
| AUSTEDO | 136 |
68 |
98% |
|||||
| ANDA | 412 |
363 |
13% |
|||||
| Other | 128 |
153 |
(16%) |
|||||
| Total | 2,373 |
2,238 |
6% |
|||||
|
||||||||
|
||||||||
Three months ended |
|
|
||||||
December 31, |
|
Percentage Change |
||||||
2019 |
|
2018 |
|
2018-2019 |
||||
(U.S.$ in millions) |
|
|
||||||
| Europe segment | ||||||||
| Generic medicines | $ |
871 |
$ |
844 |
3% |
|||
| COPAXONE | 106 |
118 |
(10%) |
|||||
| Respiratory products | 86 |
90 |
(4%) |
|||||
| Other | 122 |
152 |
(20%) |
|||||
| Total | 1,184 |
1,204 |
(2%) |
|||||
|
||||||||
|
||||||||
Three months ended |
|
|
||||||
December 31, |
|
Percentage Change |
||||||
2019 |
|
2018 |
|
2018-2019 |
||||
(U.S.$ in millions) |
|
|
||||||
| International Markets segment | ||||||||
| Generics medicines | $ |
489 |
$ |
499 |
(2%) |
|||
| COPAXONE | 17 |
20 |
(14%) |
|||||
| Distribution | 6 |
5 |
11% |
|||||
| Other | 67 |
76 |
(12%) |
|||||
| Total | 578 |
599 |
(3%) |
|||||
| Revenues by Activity and Geographical Area | ||||||||
| (Unaudited) | ||||||||
Year ended |
|
|
||||||
December 31, |
|
Percentage Change |
||||||
2019 |
|
2018 |
|
2018-2019 |
||||
(U.S.$ in millions) |
|
|
||||||
| North America segment |
|
|||||||
| Generics medicines | $ |
3,963 |
4,056 |
(2%) |
||||
| COPAXONE | 1,017 |
1,759 |
(42%) |
|||||
| Bendeka and Trenda | 496 |
642 |
(23%) |
|||||
| ProAir | 274 |
397 |
(31%) |
|||||
| QVAR | 250 |
182 |
38% |
|||||
| AJOVY | 93 |
3 |
N/A |
|||||
| AUSTEDO | 412 |
204 |
102% |
|||||
| ANDA | 1,492 |
1,347 |
11% |
|||||
| Other | 546 |
708 |
(23%) |
|||||
| Total | 8,542 |
9,297 |
(8%) |
|||||
|
||||||||
|
||||||||
Year ended |
|
|
||||||
December 31, |
|
Percentage Change |
||||||
2019 |
|
2018 |
|
2018-2019 |
||||
(U.S.$ in millions) |
|
|
||||||
| Europe segment |
|
|||||||
| Generic medicines | $ |
3,470 |
$ |
3,593 |
(3%) |
|||
| COPAXONE | 432 |
535 |
(19%) |
|||||
| Respiratory products | 354 |
402 |
(12%) |
|||||
| Other | 539 |
656 |
(18%) |
|||||
| Total | 4,795 |
5,186 |
(8%) |
|||||
|
||||||||
|
||||||||
Year ended |
|
|
||||||
December 31, |
|
Percentage Change |
||||||
2019 |
|
2018 |
|
2018-2019 |
||||
(U.S.$ in millions) |
|
|
||||||
| International Markets segment |
|
|||||||
| Generics medicines | $ |
1,893 |
$ |
2,022 |
(6%) |
|||
| COPAXONE | 63 |
72 |
(13%) |
|||||
| Distribution | 20 |
19 |
6% |
|||||
| Other | 271 |
309 |
(12%) |
|||||
| Total | 2,246 |
2,422 |
(7%) |
|||||
Revision |
|||||||
(Unaudited) |
|||||||
| The following table summarizes the impact of the revision on net revenues and non-GAAP cost of sales in the consolidated statements of income in the relevant periods: | |||||||
| Net revenues | Cost of sales | ||||||
| As reported | Adjustment | As revised | As reported | Adjustment | As revised | ||
2018 |
Q1 | 5,065 |
(149) |
4,916 |
2,447 |
(149) |
2,298 |
| Q2 | 4,701 |
(150) |
4,551 |
2,362 |
(150) |
2,212 |
|
| Q3 | 4,529 |
(143) |
4,386 |
2,268 |
(143) |
2,125 |
|
| Q4 | 4,559 |
(141) |
4,418 |
2,231 |
(141) |
2,090 |
|
2019 |
Q1 | 4,295 |
(146) |
4,149 |
2,145 |
(146) |
1,999 |
| Q2 | 4,337 |
(159) |
4,178 |
2,149 |
(159) |
1,990 |
|
| Q3 | 4,264 |
(171) |
4,093 |
2,162 |
(171) |
1,991 |
|
|
|||||||
| Revision of prior period financial statements with respect to the distribution business in our International Markets segment, decreasing sales by $165 million in Q4 2019, and $642 million in 2019, with an offsetting decrease in cost of sales. No impact on gross profit, operating income, earnings per share or cash flows for the related periods. | |||||||
| Free cash flow reconciliation | ||||||||
| (Unaudited) | ||||||||
Year ended December 31, |
||||||||
2019 |
|
2018 |
||||||
|
|
|
|
|
||||
(U.S. $ in millions) |
||||||||
| Net cash provided by operating activities | 748 |
|
2,446 |
|
||||
| Beneficial interest collected in exchange for securitized trade receivables, included in investing activities | 1,487 |
|
1,735 |
|
||||
| capital expenditures | (525 |
) |
(651 |
) |
||||
| Proceeds from sale of property, plant and equipment, intangible assets and companies | 343 |
|
150 |
|
||||
| Free cash flow | $ |
2,053 |
|
$ |
3,679 |
|
||
| Free cash flow reconciliation | ||||||||
| (Unaudited) | ||||||||
Three months ended December 31, |
||||||||
2019 |
|
2018 |
||||||
|
|
|
|
|
||||
(U.S. $ in millions) |
||||||||
| Net cash provided by operating activities | 538 |
|
367 |
|
||||
| Beneficial interest collected in exchange for securitized trade receivables, included in investing activities | 379 |
|
363 |
|
||||
| capital expenditures | (119 |
) |
(213 |
) |
||||
| Proceeds from sale of property, plant and equipment, intangible assets and companies | 176 |
|
6 |
|
||||
| Free cash flow | $ |
974 |
|
$ |
522 |
|
||
