
NEW YORK--(BUSINESS WIRE)--Americans continue to experience high levels of personal financial satisfaction thanks primarily to the stock market’s best June performance in decades. The AICPA’s Q2 2019 Personal Financial Satisfaction Index (PFSi) is down slightly from the prior quarter but still remains relatively close to its recent record high. The bull market, abundant job openings, and steadily rising home equity have Americans’ financial pleasure hovering near its all-time high. Further, as a result of delinquencies on loans continuing to trend down and underemployment reaching its lowest level on record in a tight labor market, financial pain is lower now than it was before the Great Recession.
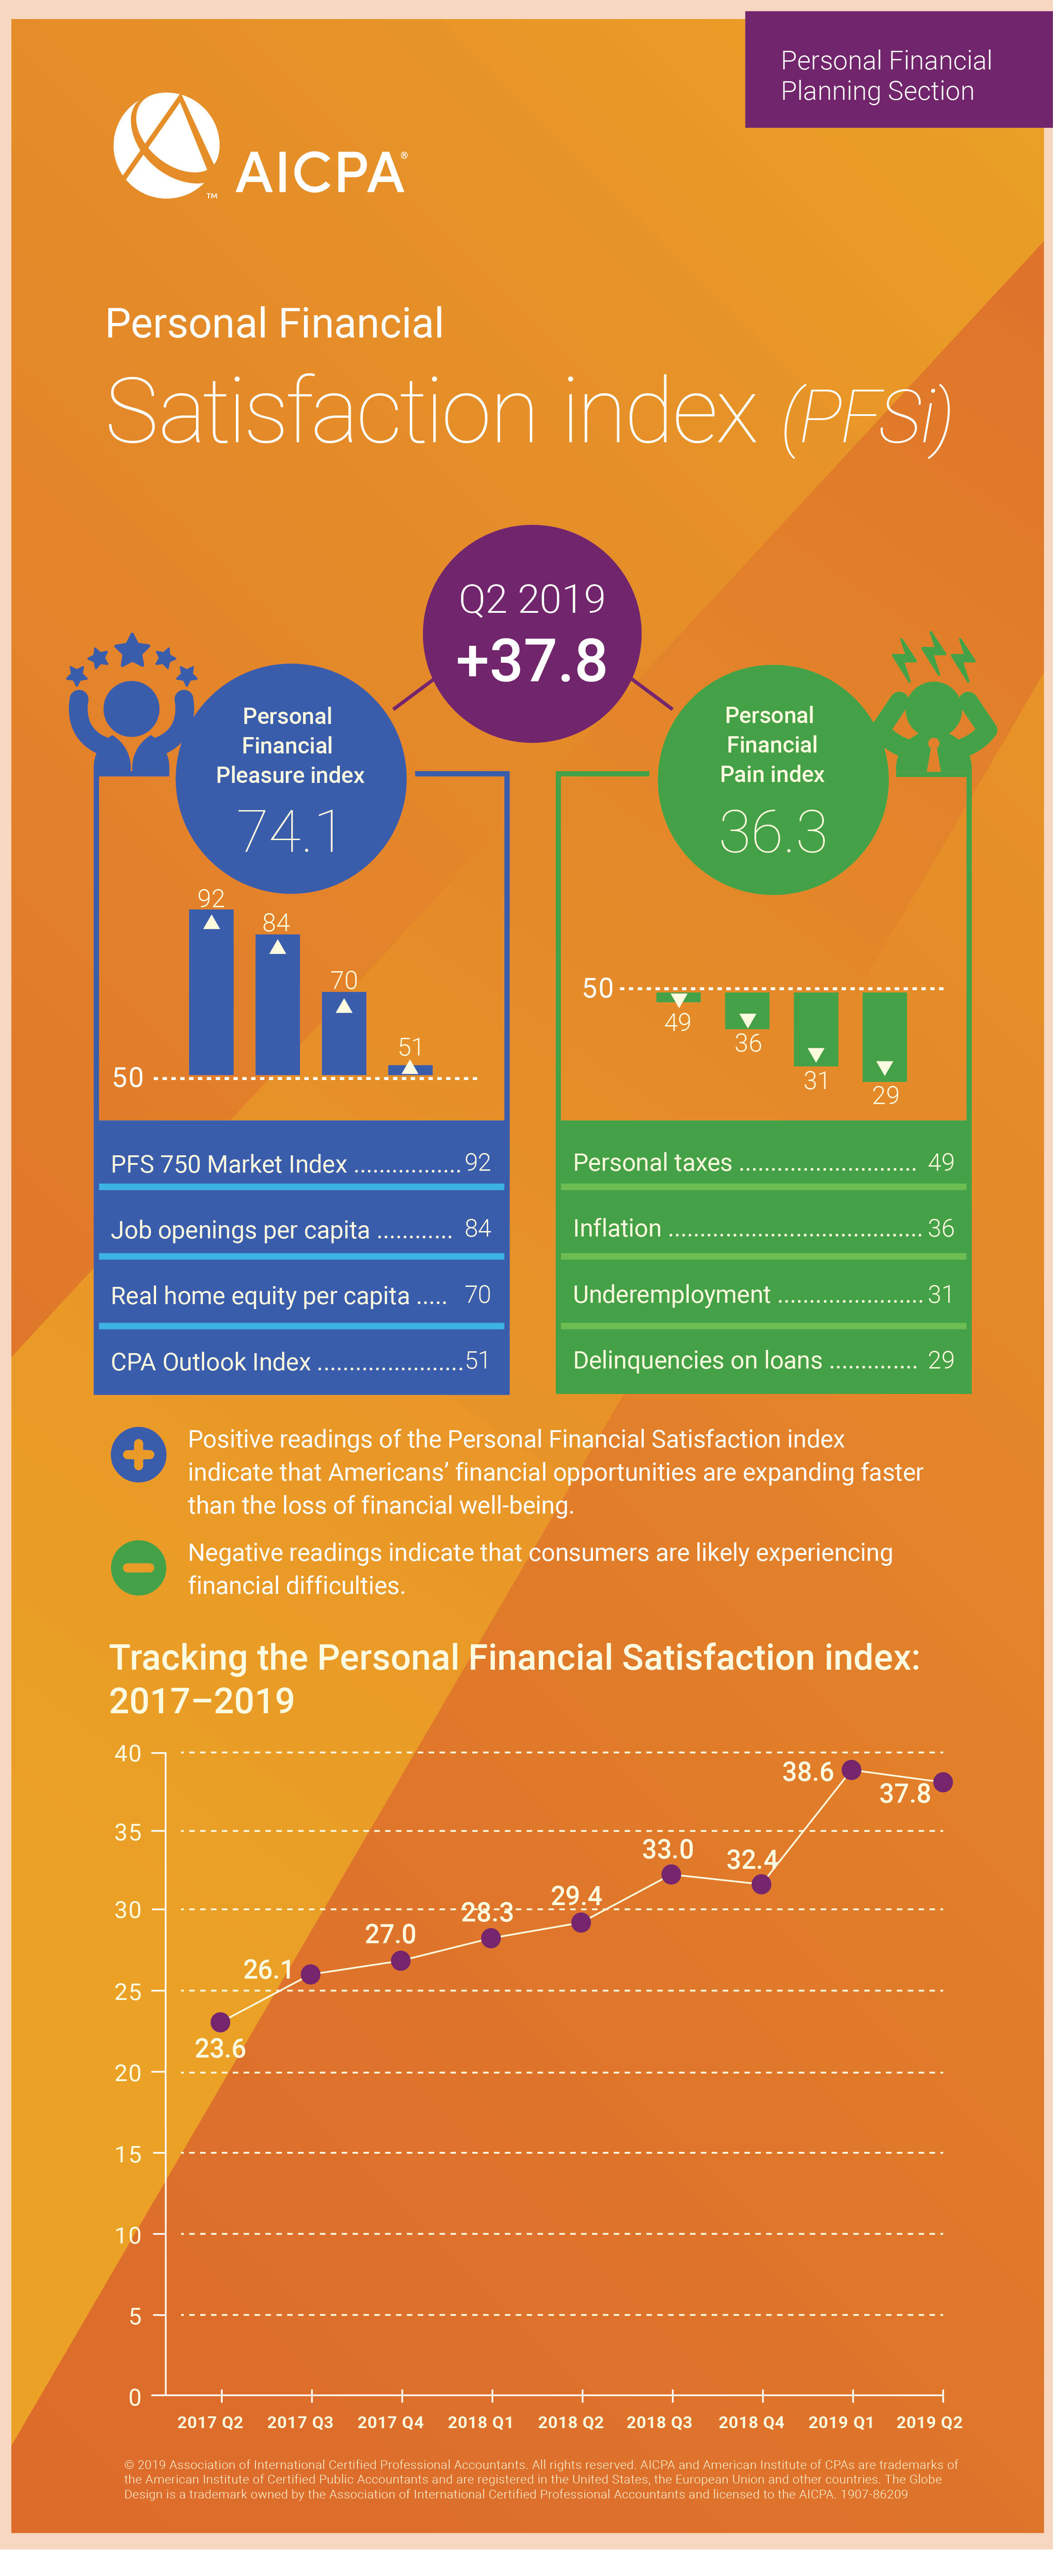
The PFSi is calculated as the Personal Financial Pleasure Index (Pleasure Index) minus the Personal Financial Pain Index (Pain Index). Positive readings indicate that the average American should be feeling a strong sense of financial well-being. The Q2 2019 PFSi measures 37.8, a 0.8 point (2.0 percent) decrease from the prior quarter. The decrease was due to the slight 0.1 point (0.1 percent) increase in the Pleasure Index being outweighed by the 0.9 point (2.5 percent) increase in the Pain Index (an increase in the Pain Index brings down the PFSi overall). This is the second time in the past year that the index has decreased.
The Pleasure Index measures 74.1, a 0.1 point (0.1 percent) increase over the prior quarter. This gain puts the Pleasure index just shy of its all-time high of 75.0 which was set in Q3 2018. The component with the most notable improvement over the last quarter was the PFS 750 Market Index. This is the AICPA’s proprietary stock index comprised of the 750 largest companies trading on the US Market adjusted for inflation and per capita. With a Q2 2019 reading of 91.9, the PFS 750 remains the leading contributor to the Pleasure Index as well as the PFSi overall and is just shy of its all-time high of 92.7 set in Q3 2018. The S&P 500, the Dow Jones industrial average and the Nasdaq composite index were all close to all-time highs at the end of June. Their performance caps off a strong first half of 2019 and a big rebound from May’s market downturn. However, the good news is slightly tempered by the fact that the improvement relied on just five digital economy companies for a third of the gains over the past quarter.
“Having the bulk of your investments in one or two stocks is a risky strategy because of their individual volatility,” said Mark Astrinos, CPA/PFS member of the AICPA Personal Financial Specialist Credential Committee. “Pullbacks are a regular occurrence for risk assets, so it is crucial to not put all your eggs in one basket—or in this case, all your investments in one company or industry. Instead, build a financial plan with a diversified and balanced portfolio that will lend itself to smoother gains and downsize risk over a longer time horizon.”
The AICPA CPA Outlook Index, which captures the expectations of CPA executives in the year ahead for their companies and the U.S. economy, declined a slight 0.9 points (1.8 percent) below the previous quarter and is down 3.7 points (6.8 percent) from last year. Compared with the year ago CPA Outlook Index, all components show declines, strongly led by US Economic Optimism whose decline was almost 3 times that of any other factor. So, while Americans are experiencing near record high levels of financial satisfaction, CPA executives are becoming somewhat more worried about the potential for an economic downturn in the year ahead.
The Personal Financial Pain Index, at 36.3, saw inflation and taxes increase from the previous quarter, combining to raise the index 0.9 points (2.5 percent). The increase in the Pain Index contributed to the decline in the PFSi overall. The Inflation Index led the increase over the preceding quarter, jumping up 4.8 point (15.5 percent). Inflation is the most volatile factor contributing to the PFSi, and with absolute levels so low, small changes result in large percent gains. The Fed has indicated that they anticipate cutting rates in the future, possibly as soon as this month.
“With the potential that the Fed may lower rates on the horizon, Americans should revisit the inflation assumptions used in their financial plans, especially if they are in, or close to, retirement. Lower rates favor the borrower over the investor. While rates are holding steady, now is a good time to review your investments and make sure they are at a minimum keeping up with inflation. Otherwise, it may be time to update your portfolio,” added Astrinos.
Pain from personal taxes increased 1.5 points (3.1 percent) over the previous quarter and is now at a reading of 49.4 for Q2 2019. This is now the sixth quarter to reflect the impact of the Tax Cuts and Jobs Act (TCJA). After TCJA led to an initial decline of 3.9 points (7.5 percent) in Q1 2018, the quarterly levels remained relatively flat. However, compared to the year-ago level, pain from taxes is up 2.1 points (4.4 percent) and is now only 2.6 points (5.1 percent) lower than its pre-TCJA reading of 52.1 in Q4 2017. The personal taxes value uses information from the Bureau of Labor Statistics on income tax, tax on realized net capital gains and taxes on personal property. Pain from personal taxes continues to be an outsize contributor to financial pain. In fact, over the last three years, the personal taxes factor has been the largest contributor to financial pain for 10 of 12 quarters.
Underemployment, at 31.2 points, is 1.1 points (3.3 percent) lower than the prior quarter and 3.2 points (9.3 percent) down from the prior year level. Since the Great Recession, underemployment has been steadily trending down and it is now tied for its all-time low which was last achieved in 2001. For comparison, its peak value of 84.3 was set in the fourth quarter of 2009. This BLS-calculated factor is a combination of full-title total unemployed numbers, all marginally attached workers, and total number of workers employed part-time for economic reasons.
Additional Findings from the Q2 2019 PFSi:
- The Job Openings Per Capita Index, the second largest contributor to the Pleasure Index, decreased 2.4 points (2.8 percent) below the prior quarter. This is only the second time in three years (since Q2 2016) this factor has decreased. (Note: Q2 2019 PFSi uses data for April).
- The Real Home Equity Per Capita index, based on data issued for January, is 3.5 percent above the prior year value and 1.8 percent ahead of the previous quarter level. It is still 10.0 percent below its 2006 all-time high.
- Delinquencies on Loans Q2 level is down 1.7 points (5.5 percent) from the previous quarter’s level and 8.7 points (23.3 percent) down from the prior year. The improvements are somewhat more heavily weighted towards all loans on the annual comparison, but mostly related to mortgages for the quarterly comparison. This loan delinquency factor is at its lowest level since the end of 2007. However, it is noteworthy that this factor is still slightly above what was typical between 1994 through 2003.
Additional information on the PFSi can be found at: www.aicpa.org/PFSi.
Personal Financial Satisfaction Index Methodology
The Personal Financial Satisfaction Index (PFSi) is the result of two component sub-indexes. It is calculated as the difference between the Personal Financial Pleasure Index and the Personal Financial Pain Index. These are comprised of four equally weighted factors, each of which measure the growth of assets and opportunities, in the case of the Pleasure Index, and the erosion of assets and opportunities, in the case of the Pain Index.
About the AICPA’s PFP Division
The AICPA’s Personal Financial Planning (PFP) Section is the premier provider of information, tools, advocacy, and guidance for CPAs and other professionals who specialize in providing estate, tax, retirement, risk management, and investment planning advice to individuals, families, and business owners. The primary objective of the PFP Section is to support its members by providing resources that enable them to perform valuable PFP services in the highest professional manner.
CPA financial planners are held to the highest ethical standards and are uniquely able to integrate their extensive knowledge of tax and business planning with all areas of personal financial planning to provide objective and comprehensive guidance for their clients. The AICPA offers the Personal Financial Specialist (PFS) credential exclusively to CPAs who have demonstrated their expertise in personal financial planning through testing, experience and learning, enabling them to gain competence and confidence in PFP disciplines.
About the American Institute of CPAs
The American Institute of CPAs (AICPA) is the world’s largest member association representing the CPA profession, with more than 429,000 members in the United States and worldwide, and a history of serving the public interest since 1887. AICPA members represent many areas of practice, including business and industry, public practice, government, education and consulting. The AICPA sets ethical standards for its members and U.S. auditing standards for private companies, nonprofit organizations, federal, state and local governments. It develops and grades the Uniform CPA Examination, offers specialized credentials, builds the pipeline of future talent and drives professional competency development to advance the vitality, relevance and quality of the profession.
About the Association of International Certified Professional Accountants
The Association of International Certified Professional Accountants (the Association) is the most influential body of professional accountants, combining the strengths of the American Institute of CPAs (AICPA) and The Chartered Institute of Management Accountants (CIMA) to power opportunity, trust and prosperity for people, businesses and economies worldwide. It represents 657,000 members and students across 179 countries and territories in public and management accounting and advocates for the public interest and business sustainability on current and emerging issues. With broad reach, rigor and resources, the Association advances the reputation, employability and quality of CPAs, CGMAs and accounting and finance professionals globally.