")
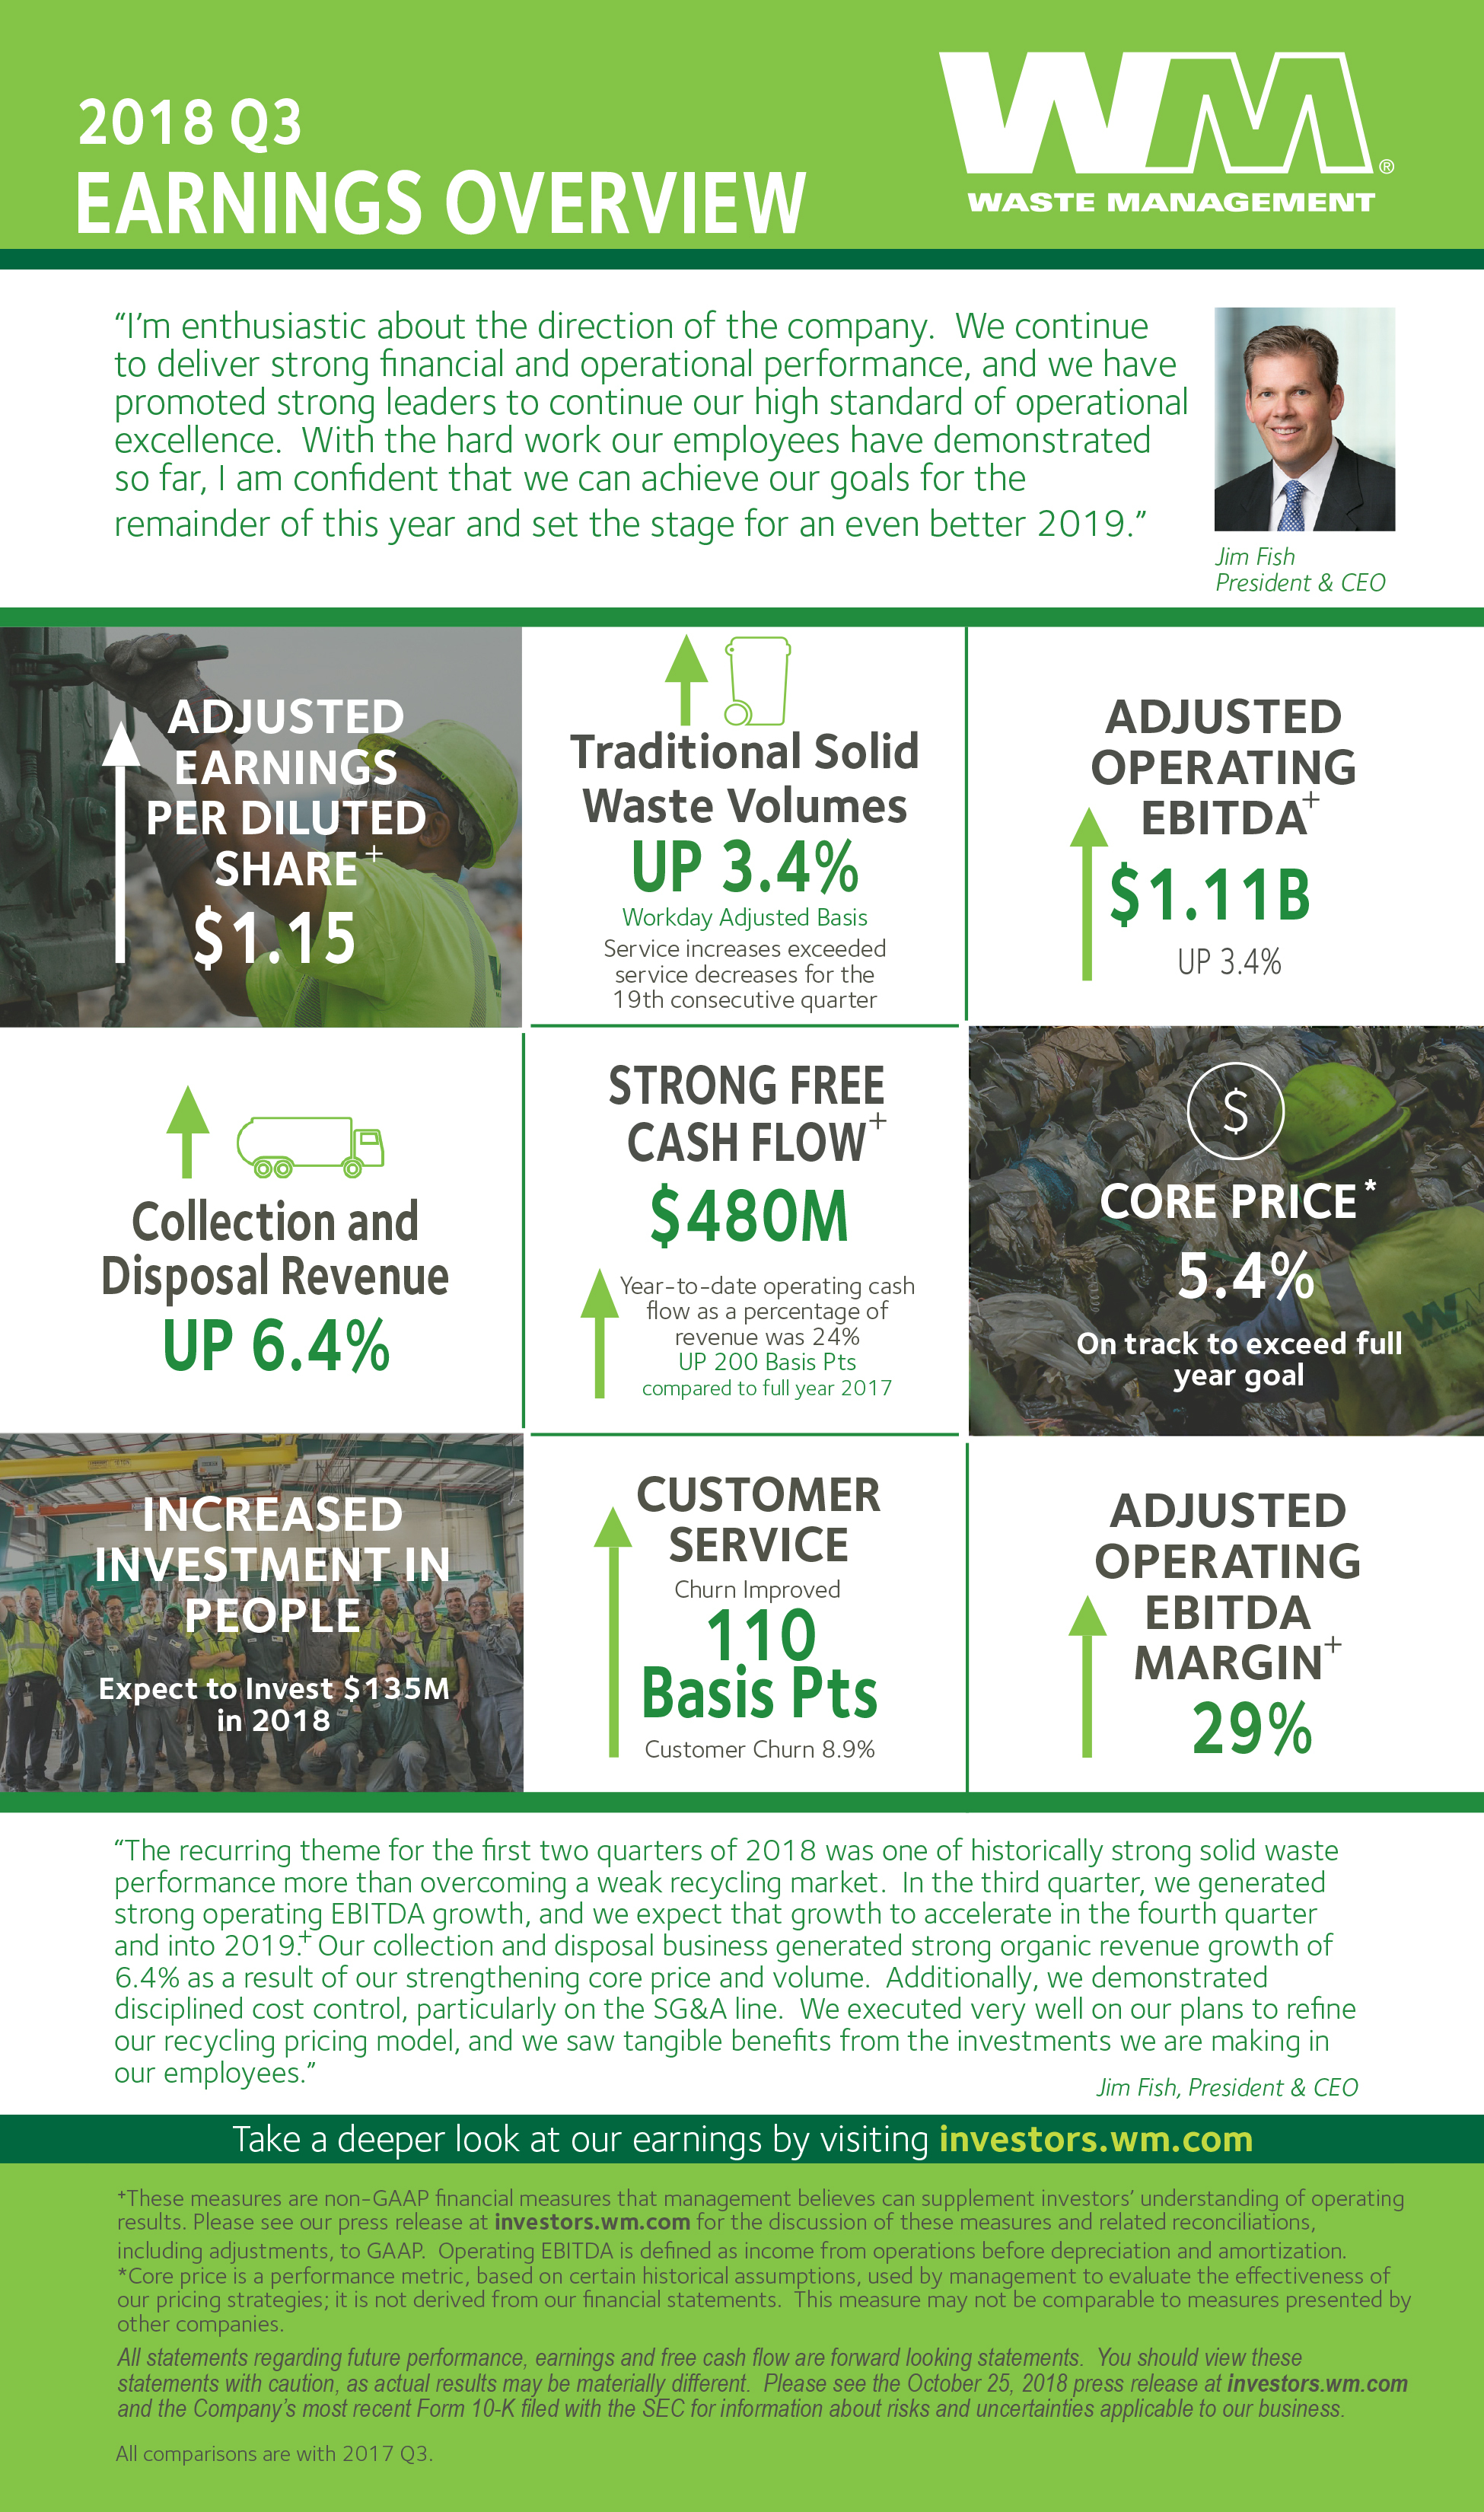
HOUSTON--(BUSINESS WIRE)--Waste Management, Inc. (NYSE:WM) today announced financial results for its quarter ended September 30, 2018. Revenues for the third quarter of 2018 were $3.82 billion, compared with $3.72 billion for the same 2017 period. Net income for the quarter was $499 million, or $1.16 per diluted share, compared with $386 million, or $0.87 per diluted share, for the third quarter of 2017.(a) On an as-adjusted basis, excluding certain items, net income was $496 million, or $1.15 per diluted share, in the third quarter of 2018, compared with $398 million, or $0.90 per diluted share, in the third quarter of 2017.(b)
The Company’s as-adjusted third quarter 2018 results exclude a $0.06 per diluted share benefit primarily resulting from favorable adjustments related to tax reform and changes in state tax laws and non-cash charges of $0.05 per diluted share primarily related to the impairment of a disposal asset.
“The recurring theme for the first two quarters of 2018 was one of historically strong solid waste performance more than overcoming a weak recycling market,” said Jim Fish, President and Chief Executive Officer of Waste Management. “In the third quarter, we generated strong operating EBITDA growth, and we expect that growth to accelerate in the fourth quarter and into 2019.(c) Our collection and disposal business generated strong organic revenue growth of 6.4% as a result of our strengthening core price and volume.(d) Additionally, we demonstrated disciplined cost control, particularly on the SG&A line. We executed very well on our plans to refine our recycling pricing model, and we saw tangible benefits from the investments we are making in our employees.”
KEY HIGHLIGHTS FOR THE THIRD QUARTER 2018
Revenue Growth
- In the third quarter, revenue growth was driven by strong yield and volume growth in the Company’s collection and disposal business, which contributed $200 million of incremental revenue. This was partially offset by a decline in revenue from the Company’s recycling line of business, which fell by $52 million year-over-year in the third quarter of 2018.
- Core price, which consists of price increases net of rollbacks and fees, excluding the Company’s fuel surcharge, was 5.4%, compared to 4.7% in the third quarter of 2017.(c)
- Internal revenue growth from yield for collection and disposal operations was 2.5% for the third quarter of 2018 versus 2.0% in the third quarter of 2017.
- Traditional solid waste internal revenue growth from volume was 3.2%, or 3.4% on a workday adjusted basis, in the third quarter of 2018. Total Company internal revenue growth from volume, which includes our recycling and other ancillary businesses, was 4.2%, or 4.4% on a workday adjusted basis, in the third quarter.
Recycling
- Average recycling commodity prices at the Company’s facilities were approximately 47% lower in the third quarter of 2018 compared to the prior year period. Results for the Company’s recycling line of business declined by approximately $0.04 per diluted share when compared to the third quarter of 2017. The Company continues to expect the full-year impact from recycling to be a negative $0.17 to $0.20 per diluted share.
Cost Management & Profitability
- As a percentage of revenue, total Company operating expenses were 62.1% in the third quarter of 2018 compared to 61.9% in the third quarter of 2017. The increase in operating expense is primarily driven by core solid waste volume growth, acquisitions, inflationary cost pressures and investment being made in the Company’s employees.
- As a percentage of revenue, SG&A expenses were 9.0% in the third quarter of 2018 compared to 9.6% in the third quarter of 2017.
- Operating EBITDA was $1.08 billion for the third quarter.(d) Adjusted operating EBITDA was $1.11 billion for the third quarter of 2018, an increase of $36 million, or 3.4%, from the third quarter of 2017.(b)
Free Cash Flow & Capital Allocation
- Net cash provided by operating activities was $874 million in the third quarter of 2018, compared to $853 million in the third quarter of 2017.
- Capital expenditures were $404 million in the third quarter of 2018, a $54 million increase from the third quarter of 2017.
- Free cash flow was $480 million in the third quarter of 2018, compared to $509 million in the third quarter of 2017.(b) The decrease in the current quarter free cash flow was driven by increased capital spending as the Company continues to invest in its fleet and disposal network to support growth.
- The Company paid $199 million in dividends to shareholders and spent $200 million to repurchase shares in the third quarter of 2018.
- The Company spent $79 million on acquisitions of traditional solid waste businesses during the third quarter of 2018.
Taxes
- The Company’s effective tax rate for the third quarter of 2018 was approximately 16.6%. Adjusting for items excluded from the Company’s as-adjusted results, the tax rate was 21.3%.(b)
UPDATED 2018 COMPANY GUIDANCE(b)
- The Company’s adjusted earnings per share guidance range increased from $4.05 to $4.10 to $4.13 to $4.15.
- The Company expects to meet or exceed analysts’ current 2018 consensus for adjusted operating EBITDA of $4.204 billion and narrows its range to $4.2 billion to $4.22 billion.
- The Company expects to meet or exceed analysts’ current 2018 consensus of $1.95 billion for free cash flow and narrows its range to $1.95 billion to $2.0 billion.
“I’m enthusiastic about the direction of the company,” Fish said. “We continue to deliver strong financial and operational performance, and we have promoted strong leaders to continue our high standard of operational excellence. With the hard work our employees have demonstrated so far, I am confident that we can achieve our goals for the remainder of this year and set the stage for an even better 2019.”
| (a) | For purposes of this press release, all references to “Net income” refer to the financial statement line item “Net income attributable to Waste Management, Inc.” | ||
| (b) | Adjusted earnings per diluted share, adjusted net income, adjusted operating EBITDA, adjusted tax rate, and free cash flow are non-GAAP measures. Please see “Non-GAAP Financial Measures” below and the reconciliations in the accompanying schedules for more information. | ||
| (c) | Management defines operating EBITDA as GAAP income from operations before depreciation and amortization; this measure may not be comparable to similarly-titled measures reported by other companies. | ||
| (d) | Core price is a performance metric used by management to evaluate the effectiveness of our pricing strategies; it is not derived from our financial statements and may not be comparable to measures presented by other companies. Core price is based on certain historical assumptions, which may differ from actual results, to allow for comparability between reporting periods and to reveal trends in results over time. | ||
The Company will host a conference call at 10:00 a.m. (Eastern) today to discuss the third quarter results. Information contained within this press release will be referenced and should be considered in conjunction with the call.
The conference call will be webcast live from the Investor Relations section of Waste Management’s website www.wm.com. To access the conference call by telephone, please dial (877) 710-6139 approximately 10 minutes prior to the scheduled start of the call. If you are calling from outside of the United States or Canada, please dial (706) 643-7398. Please utilize conference ID number 6079618 when prompted by the conference call operator.
A replay of the conference call will be available on the Company’s website www.wm.com and by telephone from approximately 1:00 p.m. (Eastern) today through 5:00 p.m. (Eastern), on Thursday, November 15, 2018. To access the replay telephonically, please dial (855) 859-2056, or from outside of the United States or Canada dial (404) 537-3406, and use the replay conference ID number 6079618.
ABOUT WASTE MANAGEMENT
Waste Management, based in Houston,
Texas, is the leading provider of comprehensive waste management
environmental services in North America. Through its subsidiaries, the
Company provides collection, transfer, disposal services, and recycling
and resource recovery. It is also a leading developer, operator and
owner of landfill gas-to-energy facilities in the United States. The
Company’s customers include residential, commercial, industrial, and
municipal customers throughout North America. To learn more information
about Waste Management, visit www.wm.com
or www.thinkgreen.com.
FORWARD-LOOKING STATEMENTS
The Company, from time to time,
provides estimates of financial and other data, comments on expectations
relating to future periods and makes statements of opinion, view or
belief about current and future events. This press release contains a
number of such forward-looking statements, including but not limited to
statements regarding 2018 earnings per diluted share; 2018 free cash
flow; 2018 operating EBITDA; future performance of the solid waste
business and future performance of the recycling business, including
impact to earnings per share. You should view these statements with
caution. They are based on the facts and circumstances known to the
Company as of the date the statements are made. These forward-looking
statements are subject to risks and uncertainties that could cause
actual results to be materially different from those set forth in such
forward-looking statements, including but not limited to, increased
competition; pricing actions; failure to implement our optimization,
growth, and cost savings initiatives and overall business strategy;
failure to identify acquisition targets and negotiate attractive terms;
failure to consummate or integrate such acquisitions; failure to obtain
the results anticipated from acquisitions; environmental and other
regulations; commodity price fluctuations; international trade
restrictions; disposal alternatives and waste diversion; declining waste
volumes; failure to develop and protect new technology; significant
environmental or other incidents resulting in liabilities and brand
damage; weakness in economic conditions; failure to obtain and maintain
necessary permits; labor disruptions; impairment charges; and negative
outcomes of litigation or governmental proceedings. Please also see the
Company’s filings with the SEC, including Part I, Item 1A of the
Company’s most recently filed Annual Report on Form 10-K, for additional
information regarding these and other risks and uncertainties applicable
to our business. The Company assumes no obligation to update any
forward-looking statement, including financial estimates and forecasts,
whether as a result of future events, circumstances or developments or
otherwise.
NON-GAAP FINANCIAL MEASURES
To supplement its financial
information, the Company, in some instances, has presented adjusted
earnings per diluted share, adjusted net income, adjusted operating
EBITDA, adjusted tax rate and free cash flow, and has also discussed
projections of adjusted earnings per diluted share, adjusted operating
EBITDA, and free cash flow; these are non-GAAP financial measures, as
defined in Regulation G of the Securities Exchange Act of 1934, as
amended. The Company reports its financial results in compliance with
GAAP but believes that also discussing non-GAAP measures provides
investors with (i) additional, meaningful comparisons of current results
to prior periods’ results by excluding items that the Company does not
believe reflect its fundamental business performance and are not
representative or indicative of its results of operations and (ii)
financial measures the Company uses in the management of its business.
The Company’s projected full year 2018 earnings per diluted share and operating EBITDA are anticipated to exclude the effects of events or circumstances in 2018 that are not representative or indicative of the Company’s results of operations. Such excluded items are not currently determinable, but may be significant, such as asset impairments and one-time items, charges, gains or losses from divestitures or litigation, or other items. Due to the uncertainty of the likelihood, amount and timing of any such items, the Company does not have information available to provide a quantitative reconciliation of adjusted projected full-year earnings per diluted share or operating EBITDA to the comparable GAAP measures.
The Company discusses free cash flow because the Company believes that it is indicative of its ability to pay its quarterly dividends, repurchase common stock, fund acquisitions and other investments and, in the absence of refinancings, to repay its debt obligations. Free cash flow is not intended to replace “Net cash provided by operating activities,” which is the most comparable GAAP measure. The Company believes free cash flow gives investors useful insight into how the Company views its liquidity, but the use of free cash flow as a liquidity measure has material limitations because it excludes certain expenditures that are required or that the Company has committed to, such as declared dividend payments and debt service requirements. The Company defines free cash flow as net cash provided by operating activities, less capital expenditures, plus proceeds from divestitures of businesses and other assets (net of cash divested); this definition may not be comparable to similarly-titled measures reported by other companies.
The quantitative reconciliations of non-GAAP measures used herein to the most comparable GAAP measures are included in the accompanying schedules, with the exception of projected earnings per diluted share and operating EBITDA. Non-GAAP measures should not be considered a substitute for financial measures presented in accordance with GAAP.
| WASTE MANAGEMENT, INC. | |||||||||||||||||||||
| CONDENSED CONSOLIDATED STATEMENTS OF OPERATIONS | |||||||||||||||||||||
| (In Millions, Except per Share Amounts) | |||||||||||||||||||||
| (Unaudited) | |||||||||||||||||||||
| Three Months Ended | Nine Months Ended | ||||||||||||||||||||
| September 30, | September 30, | ||||||||||||||||||||
| 2018 | 2017 | 2018 | 2017 | ||||||||||||||||||
| Operating revenues | $ | 3,822 | $ | 3,716 | $ | 11,072 | $ | 10,833 | |||||||||||||
| Costs and expenses: | |||||||||||||||||||||
| Operating | 2,373 | 2,302 | 6,870 | 6,758 | |||||||||||||||||
| Selling, general and administrative | 345 | 356 | 1,083 | 1,099 | |||||||||||||||||
| Depreciation and amortization | 376 | 350 | 1,107 | 1,034 | |||||||||||||||||
| Restructuring | 1 | (2 | ) | 4 | — | ||||||||||||||||
| (Gain) loss from divestitures, asset impairments and unusual items, net | 28 | 9 | (14 | ) | 10 | ||||||||||||||||
| 3,123 | 3,015 | 9,050 | 8,901 | ||||||||||||||||||
| Income from operations | 699 | 701 | 2,022 | 1,932 | |||||||||||||||||
| Other income (expense): | |||||||||||||||||||||
| Interest expense, net | (93 | ) | (90 | ) | (277 | ) | (272 | ) | |||||||||||||
| Equity in net losses of unconsolidated entities | (9 | ) | (8 | ) | (29 | ) | (53 | ) | |||||||||||||
| Other, net | — | — | 1 | — | |||||||||||||||||
| (102 | ) | (98 | ) | (305 | ) | (325 | ) | ||||||||||||||
| Income before income taxes | 597 | 603 | 1,717 | 1,607 | |||||||||||||||||
| Income tax expense | 99 | 215 | 325 | 561 | |||||||||||||||||
| Consolidated net income | 498 | 388 | 1,392 | 1,046 | |||||||||||||||||
| Less: Net income (loss) attributable to noncontrolling interests | (1 | ) | 2 | (2 | ) | — | |||||||||||||||
| Net income attributable to Waste Management, Inc. | $ | 499 | $ | 386 | $ | 1,394 | $ | 1,046 | |||||||||||||
| Basic earnings per common share | $ | 1.16 | $ | 0.88 | $ | 3.24 | $ | 2.37 | |||||||||||||
| Diluted earnings per common share | $ | 1.16 | $ | 0.87 | $ | 3.22 | $ | 2.36 | |||||||||||||
| Weighted average basic common shares outstanding | 427.9 | 437.8 | 430.3 | 440.3 | |||||||||||||||||
| Weighted average diluted common shares outstanding | 430.8 | 440.8 | 433.2 | 443.3 | |||||||||||||||||
| Cash dividends declared per common share | $ | 0.465 | $ | 0.425 | $ | 1.395 | $ | 1.275 | |||||||||||||
1
| WASTE MANAGEMENT, INC. | |||||||||
| CONDENSED CONSOLIDATED BALANCE SHEETS | |||||||||
| (In Millions) | |||||||||
| (Unaudited) | |||||||||
| September 30, | December 31, | ||||||||
| 2018 | 2017 | ||||||||
| ASSETS | |||||||||
| Current assets: | |||||||||
| Cash and cash equivalents | $ | 83 | $ | 22 | |||||
| Receivables, net | 2,342 | 2,374 | |||||||
| Other | 250 | 228 | |||||||
| Total current assets | 2,675 | 2,624 | |||||||
| Property and equipment, net | 11,815 | 11,559 | |||||||
| Goodwill | 6,390 | 6,247 | |||||||
| Other intangible assets, net | 554 | 547 | |||||||
| Other | 1,157 | 852 | |||||||
| Total assets | $ | 22,591 | $ | 21,829 | |||||
| LIABILITIES AND EQUITY | |||||||||
| Current liabilities: | |||||||||
| Accounts payable, accrued liabilities and deferred revenues | $ | 2,623 | $ | 2,523 | |||||
| Current portion of long-term debt | 447 | 739 | |||||||
| Total current liabilities | 3,070 | 3,262 | |||||||
| Long-term debt, less current portion | 9,569 | 8,752 | |||||||
| Other | 3,711 | 3,773 | |||||||
| Total liabilities | 16,350 | 15,787 | |||||||
| Equity: | |||||||||
| Waste Management, Inc. stockholders’ equity | 6,239 | 6,019 | |||||||
| Noncontrolling interests | 2 | 23 | |||||||
| Total equity | 6,241 | 6,042 | |||||||
| Total liabilities and equity | $ | 22,591 | $ | 21,829 | |||||
2
| WASTE MANAGEMENT, INC. | |||||||||||
| CONDENSED CONSOLIDATED STATEMENTS OF CASH FLOWS | |||||||||||
| (In Millions) | |||||||||||
| (Unaudited) | |||||||||||
| Nine Months Ended | |||||||||||
| September 30, | |||||||||||
| 2018 | 2017 | ||||||||||
| Cash flows from operating activities: | |||||||||||
| Consolidated net income | $ | 1,392 | $ | 1,046 | |||||||
| Adjustments to reconcile consolidated net income to net cash provided by operating activities: | |||||||||||
| Depreciation and amortization | 1,107 | 1,034 | |||||||||
| Other | 131 | 183 | |||||||||
| Change in operating assets and liabilities, net of effects of acquisitions and divestitures | 28 | 125 | |||||||||
| Net cash provided by operating activities | 2,658 | 2,388 | |||||||||
| Cash flows from investing activities: | |||||||||||
| Acquisitions of businesses, net of cash acquired | (342 | ) | (78 | ) | |||||||
| Capital expenditures | (1,240 | ) | (981 | ) | |||||||
| Proceeds from divestitures of businesses and other assets (net of cash divested) | 106 | 19 | |||||||||
| Other, net | (30 | ) | (10 | ) | |||||||
| Net cash used in investing activities | (1,506 | ) | (1,050 | ) | |||||||
| Cash flows from financing activities: | |||||||||||
| New borrowings | 174 | 197 | |||||||||
| Debt repayments | (338 | ) | (749 | ) | |||||||
| Net commercial paper borrowings | 523 | 501 | |||||||||
| Common stock repurchase program | (750 | ) | (750 | ) | |||||||
| Cash dividends | (605 | ) | (566 | ) | |||||||
| Exercise of common stock options | 45 | 92 | |||||||||
| Tax payments associated with equity-based compensation transactions | (28 | ) | (47 | ) | |||||||
| Other, net | (36 | ) | (9 | ) | |||||||
| Net cash used in financing activities | (1,015 | ) | (1,331 | ) | |||||||
| Effect of exchange rate changes on cash, cash equivalents and restricted cash and cash equivalents | — | 1 | |||||||||
| Increase in cash, cash equivalents and restricted cash and cash equivalents | 137 | 8 | |||||||||
| Cash, cash equivalents and restricted cash and cash equivalents at beginning of period | 293 | 94 | |||||||||
| Cash, cash equivalents and restricted cash and cash equivalents at end of period | $ | 430 | $ | 102 | |||||||
Prior year information has been revised to reflect the adoption of Accounting Standards Update (ASU) 2016-15 and ASU 2016-18 and conform to our current year presentation.
3
| WASTE MANAGEMENT, INC. | |||||||||||||||||||||
| SUMMARY DATE SHEET | |||||||||||||||||||||
| (In Millions) | |||||||||||||||||||||
| (Unaudited) | |||||||||||||||||||||
| Operating Revenues by Line of Business | |||||||||||||||||||||
| Three Months Ended | Nine Months Ended | ||||||||||||||||||||
| September 30, | September 30, | ||||||||||||||||||||
| 2018 | 2017 | 2018 | 2017 | ||||||||||||||||||
| Commercial | $ | 1,007 | $ | 936 | $ | 2,948 | $ | 2,764 | |||||||||||||
| Residential | 639 | 635 | 1,885 | 1,888 | |||||||||||||||||
| Industrial | 723 | 673 | 2,068 | 1,930 | |||||||||||||||||
| Other | 117 | 107 | 333 | 330 | |||||||||||||||||
| Total collection | 2,486 | 2,351 | 7,234 | 6,912 | |||||||||||||||||
| Landfill | 926 | 884 | 2,646 | 2,487 | |||||||||||||||||
| Transfer | 445 | 412 | 1,257 | 1,192 | |||||||||||||||||
| Recycling | 337 | 375 | 954 | 1,122 | |||||||||||||||||
| Other | 430 | 443 | 1,296 | 1,280 | |||||||||||||||||
| Intercompany (a) | (802 | ) | (749 | ) | (2,315 | ) | (2,160 | ) | |||||||||||||
| Total | $ | 3,822 | $ | 3,716 | $ | 11,072 | $ | 10,833 | |||||||||||||
|
Internal Revenue Growth |
|||||||||||||||||||||||||||||||||||||||||
|
Period-to-Period Change for the Three Months Ended September 30, 2018 vs. 2017 |
Period-to-Period Change for the Nine Months Ended September 30, 2018 vs. 2017 |
||||||||||||||||||||||||||||||||||||||||
| As a % of | As a % of | As a % of | As a % of | ||||||||||||||||||||||||||||||||||||||
| Related | Total | Related | Total | ||||||||||||||||||||||||||||||||||||||
| Amount | Business(b) | Amount | Company(c) | Amount | Business(b) | Amount | Company(c) | ||||||||||||||||||||||||||||||||||
| Collection and disposal | $ | 78 | 2.5 | % | $ | 218 | 2.4 | % | |||||||||||||||||||||||||||||||||
| Recycling commodities | (91 | ) | (24.3 | ) | (252 | ) | (22.5 | ) | |||||||||||||||||||||||||||||||||
| Fuel surcharges and mandated fees | 31 | 23.8 | 87 | 22.8 | |||||||||||||||||||||||||||||||||||||
| Total average yield (d) | $ | 18 | 0.5 | % | $ | 53 | 0.5 | % | |||||||||||||||||||||||||||||||||
| Volume | 155 | 4.2 | 309 | 2.9 | |||||||||||||||||||||||||||||||||||||
| Internal revenue growth | 173 | 4.7 | 362 | 3.4 | |||||||||||||||||||||||||||||||||||||
| Acquisitions | 53 | 1.4 | 142 | 1.3 | |||||||||||||||||||||||||||||||||||||
| Divestitures | (52 | ) | (1.4 | ) | (90 | ) | (0.9 | ) | |||||||||||||||||||||||||||||||||
| Foreign currency translation and other | (68 | ) | (1.8 | ) | (175 | ) | (1.6 | ) | |||||||||||||||||||||||||||||||||
| Total | $ | 106 | 2.9 | % | $ | 239 | 2.2 | % | |||||||||||||||||||||||||||||||||
| (a) | Intercompany revenues between lines of business are eliminated in the Condensed Consolidated Financial Statements included herein. | ||
| (b) | Calculated by dividing the increase or decrease for the current year period by the prior year period’s related business revenue adjusted to exclude the impacts of divestitures for the current year period. | ||
| (c) | Calculated by dividing the increase or decrease for the current year period by the prior year period’s total Company revenue adjusted to exclude the impacts of divestitures for the current year period. | ||
| (d) | The amounts reported herein represent the changes in our revenue attributable to average yield for the total Company. |
4
| WASTE MANAGEMENT, INC. | |||||||||||||||||||||
| SUMMARY DATA SHEET | |||||||||||||||||||||
| (In Millions) | |||||||||||||||||||||
| (Unaudited) | |||||||||||||||||||||
| Free Cash Flow Analysis (a) | |||||||||||||||||||||
| Three Months Ended | Nine Months Ended | ||||||||||||||||||||
| September 30, | September 30, | ||||||||||||||||||||
| 2018 | 2017 | 2018 | 2017 | ||||||||||||||||||
| Net cash provided by operating activities (b) | $ | 874 | $ | 853 | $ | 2,658 | $ | 2,388 | |||||||||||||
| Capital expenditures | (404 | ) | (350 | ) | (1,240 | ) | (981 | ) | |||||||||||||
| Proceeds from divestitures of businesses | |||||||||||||||||||||
| and other assets (net of cash divested) | 10 | 6 | 106 | 19 | |||||||||||||||||
| Free cash flow | $ | 480 | $ | 509 | $ | 1,524 | $ | 1,426 | |||||||||||||
| Three Months Ended | Nine Months Ended | ||||||||||||||||||||
| September 30, | September 30, | ||||||||||||||||||||
| 2018 | 2017 | 2018 | 2017 | ||||||||||||||||||
| Supplemental Data | |||||||||||||||||||||
| Internalization of waste, based on disposal costs | 67.9 | % | 65.6 | % | 67.4 | % | 65.9 | % | |||||||||||||
| Landfill amortizable tons (in millions) | 30.1 | 28.7 | 86.0 | 83.0 | |||||||||||||||||
| Acquisition Summary (c) | |||||||||||||||||||||
| Gross annualized revenue acquired | 47 | 16 | 215 | 58 | |||||||||||||||||
| Total consideration | 84 | 31 | 350 | 89 | |||||||||||||||||
| Cash paid for acquisitions consummated during the period, | |||||||||||||||||||||
| net of cash acquired | 73 | 26 | 336 | 77 | |||||||||||||||||
| Cash paid for acquisitions including contingent consideration | |||||||||||||||||||||
| and other items from prior periods, net of cash acquired | 79 | 29 | 348 | 80 | |||||||||||||||||
| Amortization, Accretion and Other Expenses for | |||||||||||||||||||||
| Landfills Included in Operating Groups: | Three Months Ended | Nine Months Ended | |||||||||||||||||||
| September 30, | September 30, | ||||||||||||||||||||
| 2018 | 2017 | 2018 | 2017 | ||||||||||||||||||
| Landfill amortization expense | |||||||||||||||||||||
| Cost basis of landfill assets | $ | 113.5 | $ | 104.7 | $ | 325.8 | $ | 298.6 | |||||||||||||
| Asset retirement costs | 28.0 | 23.4 | 79.9 | 80.0 | |||||||||||||||||
| Total landfill amortization expense | 141.5 | 128.1 | 405.7 | 378.6 | |||||||||||||||||
| Accretion and other related expense | 20.5 | 20.0 | 60.3 | 58.8 | |||||||||||||||||
| Landfill amortization, accretion and other related expense | $ | 162.0 | $ | 148.1 | $ | 466.0 | $ | 437.4 | |||||||||||||
| (a) | The summary of free cash flow has been prepared to highlight and facilitate understanding of the principal cash flow elements. Free cash flow is not a measure of financial performance under generally accepted accounting principles and is not intended to replace the consolidated statement of cash flows that was prepared in accordance with generally accepted accounting principles. | ||
| (b) | Prior year information has been revised to reflect the adoption of ASU 2016-18 and conform to our current year presentation. | ||
| (c) | Represents amounts associated with business acquisitions consummated during the applicable period except where noted. | ||
5
| WASTE MANAGEMENT, INC. | ||||||||||||||||||||
|
RECONCILIATION OF CERTAIN NON-GAAP MEASURES |
||||||||||||||||||||
| (In Millions, Except Per Share Amounts) | ||||||||||||||||||||
| (Unaudited) | ||||||||||||||||||||
|
Three Months Ended
September 30, 2018 |
||||||||||||||||||||
|
Income from |
Pre-tax |
Tax Expense |
Net |
Per Share |
||||||||||||||||
| As reported amounts | $ 699 | $ 597 | $ 99 | $ 499 | $ 1.16 | |||||||||||||||
| Adjustments: | ||||||||||||||||||||
| Benefit primarily related to favorable adjustments from tax reform and changes in state tax laws | - | - | 27 | (27 | ) | (0.06 | ) | |||||||||||||
| Impairment of a disposal asset and multiemployer pension plan accrual | 32 | 32 | 8 | 24 | 0.05 | |||||||||||||||
| As adjusted amounts | $ 731 | $ 629 | $ 134 | (b) | $ 496 | $ 1.15 | ||||||||||||||
|
Three Months Ended
September 30, 2017 |
||||||||||||||||||||
|
Income from |
Pre-tax |
Tax Expense |
Net |
Per Share |
||||||||||||||||
| As reported amounts | $ 701 | $ 603 | $ 215 | $ 386 | $ 0.87 | |||||||||||||||
| Adjustments: | ||||||||||||||||||||
| Withdrawal from a multiemployer pension plan | 11 | 11 | 4 | 7 | 0.02 | |||||||||||||||
| Expense from divestitures, asset impairments and unusual items | 9 | 9 | 4 | 5 | 0.01 | |||||||||||||||
| As adjusted amounts | $ 721 | $ 623 | $ 223 | (b) | $ 398 | $ 0.90 | ||||||||||||||
| Three Months Ended | ||||||||||||||||||||
| September 30, 2018 | September 30, 2017 | |||||||||||||||||||
| Adjusted Operating Expenses and Adjusted Operating Expenses Margin | Amount |
As a % of |
Amount |
As a % of |
||||||||||||||||
| Operating revenues, as reported | $ 3,822 | $ 3,716 | ||||||||||||||||||
| Operating expenses, as reported | $ 2,373 | 62.1 | % | $ 2,302 | 61.9 | % | ||||||||||||||
| Adjustment: | ||||||||||||||||||||
| Charges related to multiemployer pension plans | 3 | 11 | ||||||||||||||||||
| Adjusted operating expenses | $ 2,370 | 62.0 | % | $ 2,291 | 61.7 | % | ||||||||||||||
| (a) | For purposes of this press release table, all references to "Net income" refer to the financial statement line item "Net income attributable to Waste Management, Inc." | ||
| (b) | The Company calculates its effective tax rate based on actual dollars. When the effective tax rate is calculated by dividing the Tax Expense amount in the table above by the Pre-tax Income amount, differences occur due to rounding, as these items have been rounded in millions. The adjusted effective tax rates is 21.3% for the third quarter of 2018. | ||
6
| WASTE MANAGEMENT, INC. | |||||||||||||||||||
| RECONCILIATION OF CERTAIN NON-GAAP MEASURES | |||||||||||||||||||
| (In Millions) | |||||||||||||||||||
| (Unaudited) | |||||||||||||||||||
| Three Months Ended | |||||||||||||||||||
| September 30, 2018 | September 30, 2017 | ||||||||||||||||||
| Adjusted Operating EBITDA and Adjusted Operating EBITDA Margin | Amount |
As a % of |
Amount |
As a % of |
|||||||||||||||
| Operating revenues, as reported | $ | 3,822 | $ | 3,716 | |||||||||||||||
| Income from operations, as reported | $ | 699 | $ | 701 | |||||||||||||||
| Depreciation and amortization, as reported | 376 | 350 | |||||||||||||||||
| Operating EBITDA, as reported | $ | 1,075 | 28.1 | % | $ | 1,051 | 28.3 | % | |||||||||||
| Adjustments: | |||||||||||||||||||
| Impairment of a disposal asset and multiemployer pension plan accrual | 32 | - | |||||||||||||||||
| Withdrawal from a multiemployer pension plan | - | 11 | |||||||||||||||||
| Expense from divestitures, asset impairments and unusual items | - | 9 | |||||||||||||||||
| Adjusted operating EBITDA (a) | $ | 1,107 | 29.0 | % | $ | 1,071 | 28.8 | % | |||||||||||
| Three Months Ended | |||||||||||||||||||
| Adjusted Operating EBITDA, for comparison purposes | June 30, 2018 | June 30, 2017 | |||||||||||||||||
| Income from operations, as reported | $ | 715 | $ | 673 | |||||||||||||||
| Depreciation and amortization, as reported | 384 | 356 | |||||||||||||||||
| Operating EBITDA, as reported | $ | 1,099 | $ | 1,029 | |||||||||||||||
| Adjustment: | |||||||||||||||||||
| Benefit primarily related to the gain on divestiture of an ancillary business | (38 | ) | |||||||||||||||||
| Adjusted operating EBITDA (b) | $ | 1,061 | |||||||||||||||||
| 2018 Projected Free Cash Flow Reconciliation (c) | |||||||||||||||||||
| Scenario 1 | Scenario 2 | ||||||||||||||||||
| Net cash provided by operating activities | $ | 3,500 | $ | 3,550 | |||||||||||||||
| Capital expenditures | (1,650 | ) | (1,700 | ) | |||||||||||||||
| Proceeds from divestitures of businesses and | |||||||||||||||||||
| other assets (net of cash divested) | 100 | 150 | |||||||||||||||||
| Free cash flow | $ | 1,950 | $ | 2,000 | |||||||||||||||
| (a) | Adjusted operating EBITDA increased $36 million or 3.4% for the third quarter 2018 as compared with adjusted operating EBITDA in the third quarter 2017. | ||
| (b) | Adjusted operating EBITDA increased $32 million or 3.1% for the second quarter 2018 as compared with as reported operating EBITDA for the second quarter 2017. | ||
| (c) | The reconciliation includes two scenarios that illustrate our projected free cash flow range for 2018. The amounts used in the reconciliation are subject to many variables, some of which are not under our control and, therefore, are not necessarily indicative of actual results. | ||
7