

NEW YORK--(BUSINESS WIRE)--Citigroup Inc. (NYSE: C)
EARNINGS PER SHARE OF $1.68
NET INCOME OF $4.6 BILLION
REVENUES OF $18.9 BILLION
RETURNED $3.1 BILLION OF CAPITAL TO COMMON SHAREHOLDERS
REPURCHASED 30 MILLION COMMON SHARES
BOOK VALUE PER SHARE OF $71.67
TANGIBLE BOOK VALUE PER
SHARE OF $61.025
Citigroup Inc. today reported net income for the first quarter 2018 of $4.6 billion, or $1.68 per diluted share, on revenues of $18.9 billion. This compared to net income of $4.1 billion, or $1.35 per diluted share, on revenues of $18.4 billion for the first quarter 2017.
Revenues increased 3% from the prior-year period, driven by growth in both the Institutional Clients Group (ICG) and Global Consumer Banking (GCB), partially offset by lower revenues in Corporate / Other primarily due to the continued wind-down of legacy assets. Net income of $4.6 billion increased 13%, driven by the higher revenues and a lower effective tax rate, partially offset by higher expenses and cost of credit. Earnings per share of $1.68 increased 24% from $1.35 per diluted share in the prior-year period, driven by the growth in net income and a 7% reduction in average diluted shares outstanding.
Citi CEO Michael Corbat said, “Our first quarter results demonstrate strength and balance across our franchise and position us well for the rest of the year. We grew revenue across both our institutional and consumer businesses and delivered solid, client-led revenue gains in areas we have been investing in such as Citibanamex, TTS, Equities and the Private Bank. In addition to improving Citi’s return on capital, we maintained our focus on also improving Citi’s return of capital. During the quarter, we returned more than $3 billion in capital to common shareholders which helped drive a significant improvement in earnings per share. And we recently submitted our capital plan and believe we remain on track to meet the commitment we outlined at investor day of returning at least $60 billion over the 2017, 2018 and 2019 cycles, subject to regulatory approval.
“While market conditions have been uneven so far this year, our first quarter results show our ability to deliver for both clients and shareholders and we look forward to sustaining this momentum for the balance of the year,” Mr. Corbat concluded.
Percentage comparisons throughout this press release are calculated for the first quarter 2018 versus the first quarter 2017, unless otherwise specified.
| Citigroup | 1Q'18 | 4Q'17 | 1Q'17 | QoQ% | YoY% | |||||||||||
|
($ in millions, except as otherwise noted) |
||||||||||||||||
| Global Consumer Banking | 8,433 | 8,449 | 7,846 | - | 7% | |||||||||||
| Institutional Clients Group | 9,848 | 8,304 | 9,319 | 19% | 6% | |||||||||||
| Corporate / Other | 591 | 751 | 1,201 | (21)% | (51)% | |||||||||||
| Total Revenues | $ | 18,872 | $ | 17,504 | $ | 18,366 | 8% | 3% | ||||||||
| Expenses | $ | 10,925 | $ | 10,332 | $ | 10,723 | 6% | 2% | ||||||||
| Net Credit Losses | 1,867 | 1,880 | 1,709 | (1)% | 9% | |||||||||||
| Credit Reserve Build / (Release)(a) | (36 | ) | 165 | (77 | ) | NM | 53% | |||||||||
| Provision for Benefits and Claims | 26 | 28 | 30 | (7)% | (13)% | |||||||||||
| Total Cost of Credit | $ | 1,857 | $ | 2,073 | $ | 1,662 | (10)% | 12% | ||||||||
| Income from Continuing Operations Before Taxes | $ | 6,090 | $ | 5,099 | $ | 5,981 | 19% | 2% | ||||||||
| Provision for Income Taxes | 1,441 | 23,864 | 1,863 | (94)% | (23)% | |||||||||||
| Income (Loss) from Continuing Operations | $ | 4,649 | $ | (18,765 | ) | $ | 4,118 | NM | 13% | |||||||
| Net Income (Loss) from Discontinued Operations | (7 | ) | (109 | ) | (18 | ) | 94% | 61% | ||||||||
| Non-Controlling Interest | 22 | 19 | 10 | 16% | NM | |||||||||||
| Citigroup Net Income (Loss) | $ | 4,620 | $ | (18,893 | ) | $ | 4,090 | NM | 13% | |||||||
| Adjusted Net Income(b) | $ | 4,620 | $ | 3,701 | $ | 4,090 | 25% | 13% | ||||||||
| Revenues | ||||||||||||||||
| North America | 8,422 | 8,228 | 8,467 | 2% | (1)% | |||||||||||
| EMEA | 3,167 | 2,441 | 2,854 | 30% | 11% | |||||||||||
| Latin America | 2,557 | 2,390 | 2,336 | 7% | 9% | |||||||||||
| Asia | 4,135 | 3,694 | 3,508 | 12% | 18% | |||||||||||
| Corporate / Other | 591 | 751 | 1,201 | (21)% | (51)% | |||||||||||
| Income from Continuing Operations | ||||||||||||||||
| North America | 1,695 | (1,031 | ) | 1,691 | NM | 0% | ||||||||||
| Adjusted North America(b) | 1,695 | 1,719 | 1,691 | (1)% | 0% | |||||||||||
| EMEA | 1,113 | 431 | 862 | NM | 29% | |||||||||||
| Latin America | 674 | 498 | 617 | 35% | 9% | |||||||||||
| Asia | 1,241 | 897 | 839 | 38% | 48% | |||||||||||
| Corporate / Other | (74 | ) | (19,560 | ) | 109 | NM | NM | |||||||||
| Adjusted Corporate / Other(b) | (74 | ) | 284 | 109 | NM | NM | ||||||||||
| EOP Assets ($B) | 1,922 | 1,842 | 1,821 | 4% | 6% | |||||||||||
| EOP Loans ($B) | 673 | 667 | 629 | 1% | 7% | |||||||||||
| EOP Deposits ($B) | 1,001 | 960 | 950 | 4% | 5% | |||||||||||
| Common Equity Tier 1 Capital Ratio | 12.1 | % | 12.4 | % | 12.8 | % | ||||||||||
| Supplementary Leverage Ratio | 6.7 | % | 6.7 | % | 7.3 | % | ||||||||||
| Return on Average Common Equity | 9.7 | % | (37.5 | )% | 7.4 | % | ||||||||||
| Book Value per Share | $ | 71.67 | $ | 70.62 | $ | 75.81 | 1% | (5)% | ||||||||
| Tangible Book Value per Share | $ | 61.02 | $ | 60.16 | $ | 65.88 | 1% | (7)% | ||||||||
| Note: Please refer to the Appendices and Footnotes at the end of this press release for additional information. | ||
|
(a) |
Includes provision for unfunded lending commitments. |
|
|
(b) |
Excludes the $22.6 billion non-cash charge related to the impact of Tax Reform in 4Q'17, which increased income taxes within North America GCB ($750 million), ICG ($2.0 billion) and Corporate/Other ($19.8 billion). For additional information, please refer to Appendix A and Footnote 6. |
|
Citigroup
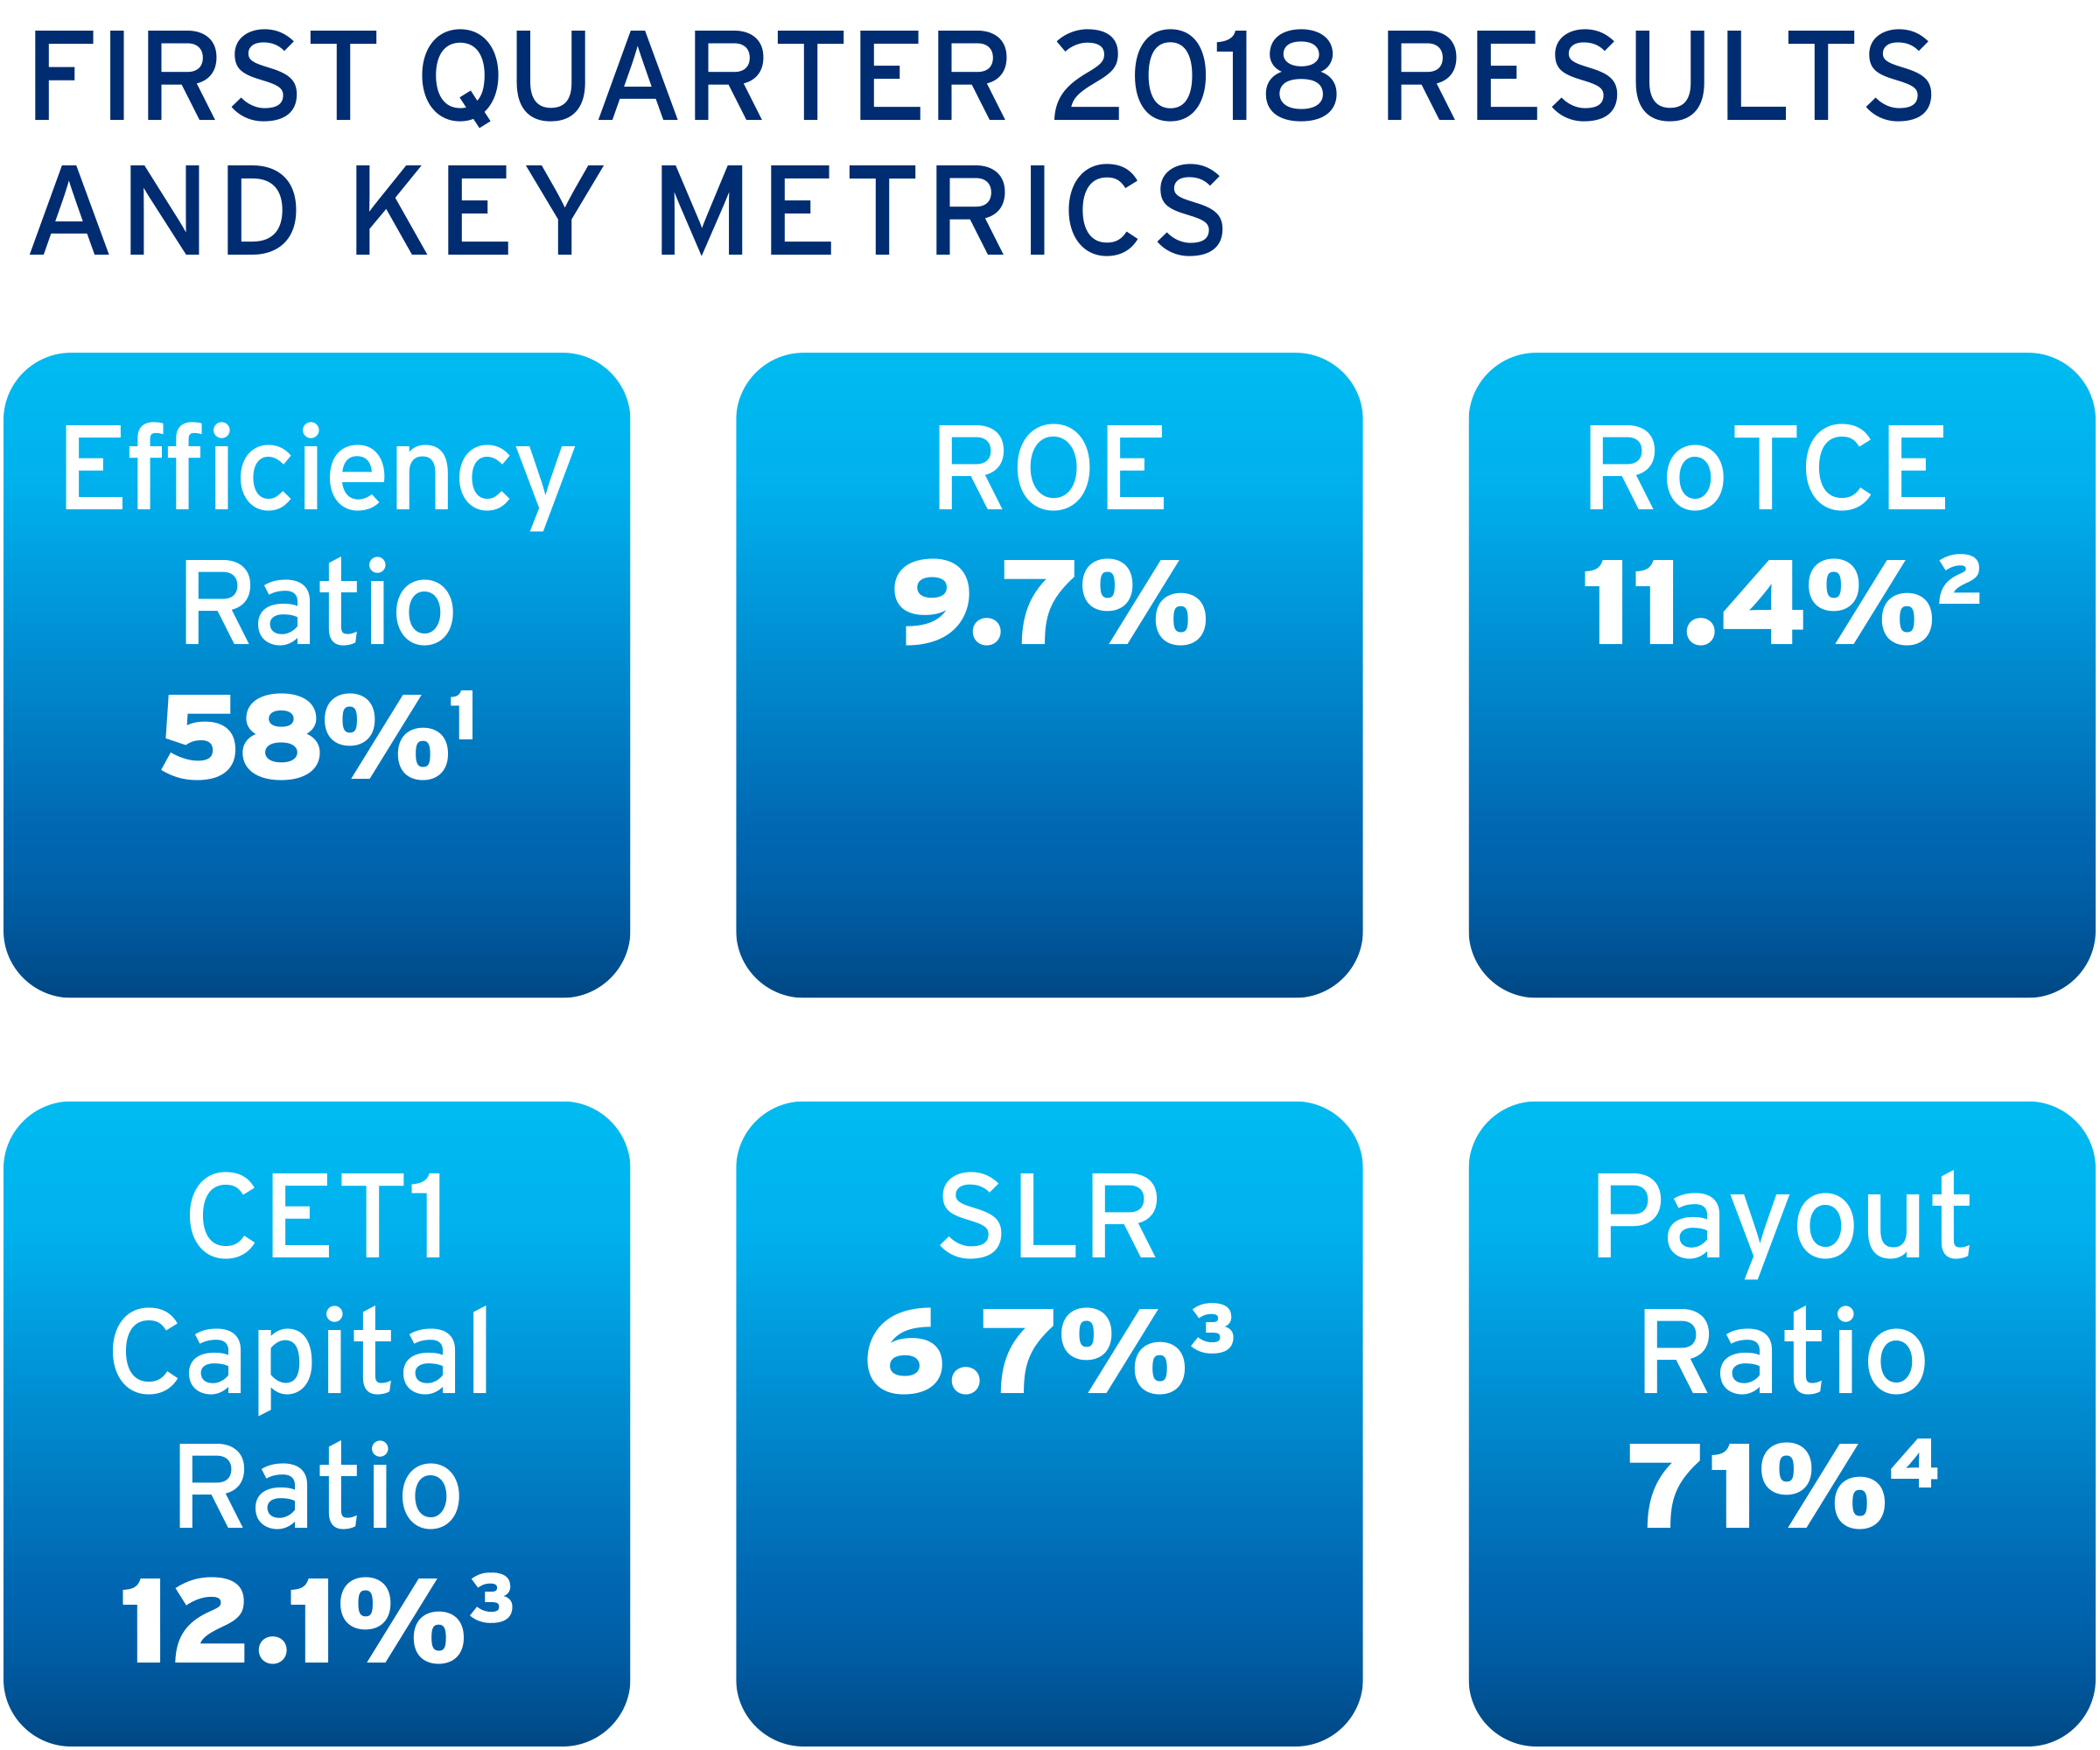
Citigroup revenues of $18.9 billion in the first quarter 2018 increased 3%, driven by 7% aggregate growth in GCB and ICG, partially offset by a 51% decrease in Corporate / Other, primarily due to the continued wind-down of legacy assets.
Citigroup’s operating expenses increased 2% to $10.9 billion in the first quarter 2018, as higher volume-related expenses and investments were partially offset by efficiency savings and the wind-down of legacy assets.
Citigroup’s cost of credit in the first quarter 2018 was $1.9 billion, a 12% increase, driven by ICG as well as volume growth and seasoning in GCB.
Citigroup’s net income increased to $4.6 billion in the first quarter 2018, primarily driven by the higher revenues and a lower effective tax rate, which more than offset the higher expenses and cost of credit. Citigroup’s effective tax rate was 24% in the current quarter compared to 31% in the first quarter 2017.
Citigroup’s allowance for loan losses was $12.4 billion at quarter end, or 1.85% of total loans, compared to $12.0 billion, or 1.93% of total loans, at the end of the prior-year period. Total non-accrual assets declined 20% from the prior-year period to $4.4 billion. Consumer non-accrual loans declined 13% to $2.6 billion and corporate non-accrual loans decreased 29% to $1.7 billion.
Citigroup’s end of period loans were $673 billion as of quarter end, up 7% from the prior-year period. Excluding the impact of foreign exchange translation7, Citigroup’s end of period loans grew 6%, as 7% aggregate growth in ICG and GCB was partially offset by the continued wind-down of legacy assets in Corporate / Other.
Citigroup’s end of period deposits were $1.0 trillion as of quarter end, up 5%. In constant dollars, Citigroup deposits were up 3%, as ICG grew 5% and GCB remained largely unchanged.
Citigroup’s book value per share was $71.67 and tangible book value per share was $61.02, each at quarter end, representing decreases of 5% and 7%, respectively, primarily reflecting the impact of Tax Reform. Sequentially, book value per share and tangible book value per share both increased 1%. At quarter end, Citigroup’s CET1 Capital ratio8 was 12.1%, down from 12.4% sequentially, due to an increase in risk weighted assets driven by loan growth and client activity, as well as the return of capital to common shareholders, partially offset by net income. Citigroup’s SLR8 for the first quarter 2018 was 6.7%, unchanged sequentially. During the first quarter 2018, Citigroup repurchased 30 million common shares and returned a total of $3.1 billion to common shareholders in the form of common share repurchases and dividends.
| Global Consumer Banking | 1Q'18 | 4Q'17 | 1Q'17 | QoQ% | YoY% | ||||||||
|
($ in millions, except as otherwise noted) |
|||||||||||||
| North America | 5,157 | 5,182 | 4,945 | - | 4% | ||||||||
| Latin America | 1,347 | 1,359 | 1,167 | (1)% | 15% | ||||||||
| Asia(a) | 1,929 | 1,908 | 1,734 | 1% | 11% | ||||||||
| Total Revenues | $ | 8,433 | $ | 8,449 | $ | 7,846 | - | 7% | |||||
| North America | 2,645 | 2,568 | 2,597 | 3% | 2% | ||||||||
| Latin America | 759 | 768 | 667 | (1)% | 14% | ||||||||
| Asia(a) | 1,277 | 1,227 | 1,187 | 4% | 8% | ||||||||
| Expenses | $ | 4,681 | $ | 4,563 | $ | 4,451 | 3% | 5% | |||||
| Net Credit Losses | 1,736 | 1,640 | 1,603 | 6% | 8% | ||||||||
| Credit Reserve Build / (Release)(b) | 143 | 175 | 183 | (18)% | (22)% | ||||||||
| Provision for Benefits and Claims | 26 | 36 | 29 | (28)% | (10)% | ||||||||
| Total Cost of Credit | $ | 1,905 | $ | 1,851 | $ | 1,815 | 3% | 5% | |||||
| Net Income | $ | 1,392 | $ | 580 | $ | 997 | NM | 40% | |||||
| Adjusted Net Income(c) | $ | 1,392 | $ | 1,330 | $ | 997 | 5% | 40% | |||||
| Income from Continuing Operations | |||||||||||||
| North America | 838 | 77 | 614 | NM | 36% | ||||||||
| Adjusted North America(c) | 838 | 827 | 614 | 1% | 36% | ||||||||
| Latin America | 183 | 165 | 135 | 11% | 36% | ||||||||
| Asia(a) | 373 | 340 | 249 | 10% | 50% | ||||||||
| Key Indicators ($B) | |||||||||||||
| Retail Banking Average Loans | 147 | 145 | 139 | 1% | 6% | ||||||||
| Retail Banking Average Deposits | 309 | 307 | 303 | 1% | 2% | ||||||||
| Investment AUMs | 164 | 161 | 147 | 2% | 11% | ||||||||
| Cards Average Loans | 159 | 158 | 151 | 1% | 6% | ||||||||
| Cards Purchase Sales | 122 | 136 | 112 | (11)% | 8% | ||||||||
| Note: Please refer to the Appendices and Footnotes at the end of this press release for additional information. | ||
|
(a) |
Asia GCB includes the results of operations of GCB activities in certain EMEA countries for all periods presented. |
|
|
(b) |
Includes provision for unfunded lending commitments. |
|
|
(c) |
Excludes the impact of Tax Reform in 4Q'17 of $750 million in North America GCB. For additional information, please refer to Footnote 6. |
|
Global Consumer Banking
GCB revenues of $8.4 billion increased 7%, driven by growth across all regions and the impact of the Hilton portfolio sale in North America Citi-Branded Cards9. In constant dollars, revenues increased 6% and 4% excluding the sale of the Hilton portfolio.
North America GCB revenues of $5.2 billion increased 4%, driven by higher revenues across all businesses. Retail Banking revenues of $1.3 billion increased 4%. Excluding mortgage, retail banking revenues increased 8%, driven by continued growth in deposit margins, growth in investments and loans, and increased commercial banking activity. Citi-Branded Cards revenues of $2.2 billion increased 6%, driven by the sale of the Hilton portfolio. Excluding Hilton, revenues were roughly flat, as growth in interest-earning balances was offset by higher cost of funds and the impact of additional partnership terms. Citi Retail Services revenues of $1.6 billion increased 2%, primarily reflecting continued loan growth.
Latin America GCB revenues increased 15% to $1.3 billion. In constant dollars, revenues increased 8%. On this basis, retail banking revenues grew 7%, with continued volume growth across loans and deposits, as well as improved deposit spreads. Card revenues increased 13%, driven by continued growth in purchase sales and full rate revolving loans, as well as a favorable prior-period comparison.
Asia GCB revenues increased 11% to $1.9 billion. In constant dollars, revenues increased 7%. On this basis, retail banking revenues increased 8%, driven by strong growth in wealth management and a modest one time gain. Excluding the gain, retail banking revenues grew 6%. Card revenues increased 5%, reflecting growth in loans and purchase sales.
GCB operating expenses were $4.7 billion, up 5%. In constant dollars, expenses increased 3%, as higher investments and volume-related expenses were partially offset by efficiency saves across all three regions.
GCB cost of credit was $1.9 billion, up 5%. In constant dollars, cost of credit increased 3%, as a 7% increase in net credit losses was driven by volume growth and seasoning in North America Cards.
GCB net income of $1.4 billion increased 40%. In constant dollars, net income increased 37%, as the higher revenues across regions and a lower tax rate were partially offset by the higher expenses and cost of credit.
| Institutional Clients Group | 1Q'18 | 4Q'17 | 1Q'17 | QoQ% | YoY% | |||||||||||
|
($ in millions) |
||||||||||||||||
| Treasury & Trade Solutions | 2,268 | 2,236 | 2,108 | 1% | 8% | |||||||||||
| Investment Banking | 1,130 | 1,293 | 1,262 | (13)% | (10)% | |||||||||||
| Private Bank | 904 | 776 | 749 | 16% | 21% | |||||||||||
| Corporate Lending(a) | 521 | 513 | 438 | 2% | 19% | |||||||||||
| Total Banking | 4,823 | 4,818 | 4,557 | - | 6% | |||||||||||
| Fixed Income Markets | 3,418 | 2,463 | 3,678 | 39% | (7)% | |||||||||||
| Equity Markets | 1,103 | 567 | 802 | 95% | 38% | |||||||||||
| Securities Services | 641 | 612 | 552 | 5% | 16% | |||||||||||
| Other | (160 | ) | (177 | ) | (155 | ) | 10% | (3)% | ||||||||
| Total Markets & Securities Services | 5,002 | 3,465 | 4,877 | 44% | 3% | |||||||||||
| Product Revenues(a) | $ | 9,825 | $ | 8,283 | $ | 9,434 | 19% | 4% | ||||||||
| Gain / (Loss) on Loan Hedges | 23 | 21 | (115 | ) | 10% | NM | ||||||||||
| Total Revenues | $ | 9,848 | $ | 8,304 | $ | 9,319 | 19% | 6% | ||||||||
| Expenses | $ | 5,503 | $ | 4,912 | $ | 5,138 | 12% | 7% | ||||||||
| Net Credit Losses | 105 | 225 | 25 | (53)% | NM | |||||||||||
| Credit Reserve Build / (Release)(b) | (146 | ) | 42 | (230 | ) | NM | 37% | |||||||||
| Total Cost of Credit | $ | (41 | ) | $ | 267 | $ | (205 | ) | NM | 80% | ||||||
| Net Income | $ | 3,314 | $ | 203 | $ | 2,996 | NM | 11% | ||||||||
| Adjusted Net Income(c) | $ | 3,314 | $ | 2,203 | $ | 2,996 | 50% | 11% | ||||||||
| Revenues | ||||||||||||||||
| North America | 3,265 | 3,046 | 3,522 | 7% | (7)% | |||||||||||
| EMEA | 3,167 | 2,441 | 2,854 | 30% | 11% | |||||||||||
| Latin America | 1,210 | 1,031 | 1,169 | 17% | 4% | |||||||||||
| Asia | 2,206 | 1,786 | 1,774 | 24% | 24% | |||||||||||
| Income from Continuing Operations | ||||||||||||||||
| North America | 857 | (1,108 | ) | 1,077 | NM | (20)% | ||||||||||
| Adjusted North America(c) | 857 | 892 | 1,077 | (4)% | (20)% | |||||||||||
| EMEA | 1,113 | 431 | 862 | NM | 29% | |||||||||||
| Latin America | 491 | 333 | 482 | 47% | 2% | |||||||||||
| Asia | 868 | 557 | 590 | 56% | 47% | |||||||||||
| Note: Please refer to the Appendices and Footnotes at the end of this press release for additional information. | ||
|
(a) |
Excludes gain / (loss) on credit derivatives as well as the mark-to-market on loans at fair value. For additional information, please refer to Footnote 10. |
|
|
(b) |
Includes provision for unfunded lending commitments. |
|
|
(c) |
Excludes the impact of Tax Reform in 4Q'17 of $2.0 billion. For additional information, please refer to Footnote 6. |
|
Institutional Clients Group
ICG revenues of $9.8 billion increased 6%, as growth in Treasury and Trade Solutions, Private Bank, Corporate Lending, Equity Markets and Securities Services more than offset declines in Investment Banking and Fixed Income Markets.
Banking revenues of $4.8 billion increased 9% (including gain / (loss) on loan hedges)10. Excluding gain / (loss) on loan hedges in Corporate Lending, Banking revenues increased 6%. Treasury and Trade Solutions revenues of $2.3 billion increased 8%, reflecting higher volumes and improved deposit spreads with growth in both net interest and fee revenues. Investment Banking revenues of $1.1 billion were down 10% versus the prior-year period, reflecting declines in the overall market wallet and the timing of episodic deal activity. Advisory revenues decreased 14% to $215 million, equity underwriting revenues decreased 14% to $216 million and debt underwriting revenues decreased 8% to $699 million. Private Bank revenues increased 21% to $904 million, driven by growth in clients, loans, investments and deposits, as well as improved deposit spreads. Corporate Lending revenues of $521 million increased 19% (excluding gain / (loss) on loan hedges), reflecting loan growth as well as lower hedging costs.
Markets and Securities Services revenues of $5.0 billion increased 3%, as a decline in Fixed Income Markets revenues was more than offset by strong revenue growth in Equity Markets and Securities Services. Fixed Income Markets revenues of $3.4 billion in the first quarter 2018 decreased 7%, driven by a less favorable environment and lower investor client activity in G10 rates and spread products partially offset by strong corporate client activity in G10 foreign exchange and local markets rates and currencies. Equity Markets revenues of $1.1 billion increased 38%, with growth across all products, as volatility increased and momentum with investor clients continued. Securities Services revenues of $641 million increased 16%, driven by continued growth in client volumes and higher interest revenue.
ICG net income of $3.3 billion increased 11%, driven by the higher revenues and a lower tax rate, partially offset by higher operating expenses and cost of credit. ICG operating expenses increased 7% to $5.5 billion, driven by the impact of foreign exchange translation and investments. ICG cost of credit included net credit losses of $105 million ($25 million in the prior-year period) and a net loan loss release of $146 million (net loan loss release of $230 million in the prior-year period).
| Corporate / Other | 1Q'18 | 4Q'17 | 1Q'17 | QoQ% | YoY% | |||||||||||
|
($ in millions) |
||||||||||||||||
| Revenues | $ | 591 | $ | 751 | $ | 1,201 | (21)% | (51)% | ||||||||
| Expenses | $ | 741 | $ | 857 | $ | 1,134 | (14)% | (35)% | ||||||||
| Net Credit Losses | 26 | 15 | 81 | 73% | (68)% | |||||||||||
| Credit Reserve Build / (Release)(a) | (33 | ) | (52 | ) | (30 | ) | 37% | (10)% | ||||||||
| Provision for Benefits and Claims | - | (8 | ) | 1 | 100% | (100)% | ||||||||||
| Total Cost of Credit | $ | (7 | ) | $ | (45 | ) | $ | 52 | 84% | NM | ||||||
| Net Income (Loss) | $ | (86 | ) | $ | (19,676 | ) | $ | 97 | NM | NM | ||||||
| Adjusted Net Income (Loss)(b) | $ | (86 | ) | $ | 168 | $ | 97 | NM | NM | |||||||
|
(a) |
Includes provision for unfunded lending commitments. |
|
|
(b) |
Excludes the impact of Tax Reform in 4Q'17 of $19.8 billion. For additional information, please refer to Footnote 6. |
|
Corporate / Other
Corporate / Other revenues of $591 million decreased 51% from the prior-year period, primarily driven by the wind-down of legacy assets.
Corporate / Other’s net loss of $86 million, compared to net income of $97 million in the prior-year period. This decline was driven primarily by the lower revenues, partially offset by lower expenses reflecting the wind-down of legacy assets.
Citigroup will host a conference call today at 11:30 AM (ET). A live webcast of the presentation, as well as financial results and presentation materials, will be available at http://www.citigroup.com/citi/investor. Dial-in numbers for the conference call are as follows: (866) 516-9582 in the U.S. and Canada; (973) 409-9210 outside of the U.S. and Canada. The conference code for both numbers is 83783998.
Additional financial, statistical and business-related information, as well as business and segment trends, is included in a Quarterly Financial Data Supplement. Both this earnings release and Citigroup’s First Quarter 2018 Quarterly Financial Data Supplement are available on Citigroup’s website at www.citigroup.com.
Citigroup, the leading global bank, has approximately 200 million customer accounts and does business in more than 160 countries and jurisdictions. Citigroup provides consumers, corporations, governments and institutions with a broad range of financial products and services, including consumer banking and credit, corporate and investment banking, securities brokerage, transaction services, and wealth management.
Additional information may be found at www.citigroup.com | Twitter: @Citi | YouTube: www.youtube.com/citi | Blog: http://blog.citigroup.com | Facebook: www.facebook.com/citi | LinkedIn: www.linkedin.com/company/citi
Certain statements in this release are “forward-looking statements” within the meaning of the rules and regulations of the U.S. Securities and Exchange Commission (SEC). These statements are based on management’s current expectations and are subject to uncertainty and changes in circumstances. These statements are not guarantees of future results or occurrences. Actual results and capital and other financial condition may differ materially from those included in these statements due to a variety of factors, including the precautionary statements included in this release and those contained in Citigroup’s filings with the SEC, including without limitation the “Risk Factors” section of Citigroup’s 2017 Annual Report on Form 10-K. Any forward-looking statements made by or on behalf of Citigroup speak only as to the date they are made, and Citigroup does not undertake to update forward-looking statements to reflect the impact of circumstances or events that arise after the date the forward-looking statements were made.
| Appendix A | |||||||||||
| Citigroup | 1Q'18 | 4Q'17 | 1Q'17 | ||||||||
|
($ in millions) |
|||||||||||
| Reported Net Income (Loss) | $ | 4,620 | $ | (18,893 | ) | $ | 4,090 | ||||
| Impact of: | |||||||||||
| Tax Reform | - | (22,594 | ) | - | |||||||
| Adjusted Net Income | $ | 4,620 | $ | 3,701 | $ | 4,090 | |||||
| Less: Preferred Dividends | 272 | 320 | 301 | ||||||||
| Adjusted Net Income to Common Shareholders | $ | 4,348 | $ | 3,381 | $ | 3,789 | |||||
| Common Share Repurchases | 2,275 | ||||||||||
| Common Dividends | 826 | ||||||||||
| Total Capital Returned to Common Shareholders | $ | 3,101 | |||||||||
| Payout Ratio | 71 | % | |||||||||
| Reported Average TCE | $ | 155,107 | |||||||||
| RoTCE | 11.4 | % | |||||||||
| Appendix B | ||||||
| Citigroup | 1Q'18 | 1Q'17 | ||||
|
($ in billions) |
||||||
| Reported EOP Loans | $ | 673 | $ | 629 | ||
| Impact of FX Translation | - | 9 | ||||
| EOP Loans in Constant Dollars | $ | 673 | $ | 638 | ||
| Reported EOP Deposits | $ | 1,001 | $ | 950 | ||
| Impact of FX Translation | - | 19 | ||||
| EOP Deposits in Constant Dollars | $ | 1,001 | $ | 969 | ||
| Note: Totals may not sum due to rounding. | ||||||
| Global Consumer Banking | 1Q'18 | 1Q'17 | ||||
|
($ in millions) |
||||||
| Reported Revenues | $ | 8,433 | $ | 7,846 | ||
| Impact of FX Translation | - | 139 | ||||
| Revenues in Constant Dollars | $ | 8,433 | $ | 7,985 | ||
| Reported Expenses | $ | 4,681 | $ | 4,451 | ||
| Impact of FX Translation | - | 87 | ||||
| Expenses in Constant Dollars | $ | 4,681 | $ | 4,538 | ||
| Reported Credit Costs | $ | 1,905 | $ | 1,815 | ||
| Impact of FX Translation | - | 27 | ||||
| Credit Costs in Constant Dollars | $ | 1,905 | $ | 1,842 | ||
| Reported Net Income | $ | 1,392 | $ | 997 | ||
| Impact of FX Translation | - | 18 | ||||
| Net Income in Constant Dollars | $ | 1,392 | $ | 1,015 | ||
| Note: Totals may not sum due to rounding. | ||||||
| Latin America Consumer Banking | 1Q'18 | 1Q'17 | ||||
|
($ in millions) |
||||||
| Reported Revenues | $ | 1,347 | $ | 1,167 | ||
| Impact of FX Translation | - | 75 | ||||
| Revenues in Constant Dollars | $ | 1,347 | $ | 1,242 | ||
| Reported Retail Banking Revenues | $ | 966 | $ | 850 | ||
| Impact of FX Translation | - | 55 | ||||
| Retail Banking Revenues in Constant Dollars | $ | 966 | $ | 905 | ||
| Reported Branded Cards Revenues | $ | 381 | $ | 317 | ||
| Impact of FX Translation | - | 20 | ||||
| Branded Cards Revenues in Constant Dollars | $ | 381 | $ | 337 | ||
| Note: Totals may not sum due to rounding. | ||||||
| Asia Consumer Banking(1) | 1Q'18 | 1Q'17 | ||||
|
($ in millions) |
||||||
| Reported Revenues | $ | 1,929 | $ | 1,734 | ||
| Impact of FX Translation | - | 64 | ||||
| Revenues in Constant Dollars | $ | 1,929 | $ | 1,798 | ||
| Reported Retail Banking Revenues | $ | 1,198 | $ | 1,068 | ||
| Impact of FX Translation | - | 37 | ||||
| Retail Banking Revenues in Constant Dollars | $ | 1,198 | $ | 1,105 | ||
| Reported Branded Cards Revenues | $ | 731 | $ | 666 | ||
| Impact of FX Translation | - | 27 | ||||
| Branded Cards Revenues in Constant Dollars | $ | 731 | $ | 693 | ||
| Note: Totals may not sum due to rounding. | ||||||
| (1) Asia GCB includes the results of operations in EMEA GCB for all periods presented. | ||||||
| Appendix C | ||||||||||||
|
($ in millions) |
3/31/2018(1) |
12/31/2017 | 3/31/2017 | |||||||||
| Citigroup Common Stockholders' Equity(2) | $ | 182,942 | $ | 181,671 | $ | 208,907 | ||||||
| Add: Qualifying noncontrolling interests | 140 | 153 | 133 | |||||||||
| Regulatory Capital Adjustments and Deductions: | ||||||||||||
| Less: | ||||||||||||
|
Accumulated net unrealized losses on cash flow hedges, net of tax(3) |
(920 | ) | (698 | ) | (562 | ) | ||||||
|
Cumulative unrealized net gain (loss) related to changes in fair value of financial liabilities attributable to own creditworthiness, net of tax(4) |
(498 | ) | (721 | ) | (173 | ) | ||||||
| Intangible Assets: | ||||||||||||
| Goodwill, net of related deferred tax liabilities (DTLs)(5) | 22,482 | 22,052 | 21,448 | |||||||||
|
Identifiable intangible assets other than mortgage servicing rights (MSRs), net of related DTLs |
4,209 | 4,401 | 4,738 | |||||||||
| Defined benefit pension plan net assets | 871 | 896 | 836 | |||||||||
|
Deferred tax assets (DTAs) arising from net operating loss, foreign tax credit and general business credit carry-forwards |
12,811 | 13,072 | 21,077 | |||||||||
|
Excess over 10% / 15% limitations for other DTAs, certain common stock investments, and MSRs(6) |
- | - | 9,012 | |||||||||
| Common Equity Tier 1 Capital (CET1) | $ | 144,127 | $ | 142,822 | $ | 152,664 | ||||||
| Risk-Weighted Assets (RWA) | $ | 1,195,020 | $ | 1,155,099 | $ | 1,191,397 | ||||||
| Common Equity Tier 1 Capital Ratio (CET1 / RWA) | 12.1 | % | 12.4 | % | 12.8 | % | ||||||
| Note: | Citi's reportable CET1 Capital ratios were derived under the U.S. Basel III Standardized Approach framework as of March 31, 2018 and December 31, 2017, and the U.S. Basel III Advanced Approaches framework as of March 31, 2017. This reflects the lower of the CET1 Capital ratios under both the Standardized Approach and the Advanced Approaches under the Collins Amendment. | |
| (1) | Preliminary. | |
| (2) | Excludes issuance costs related to outstanding preferred stock in accordance with Federal Reserve Board regulatory reporting requirements. | |
| (3) | Common Equity Tier 1 Capital is adjusted for accumulated net unrealized gains (losses) on cash flow hedges included in accumulated other comprehensive income that relate to the hedging of items not recognized at fair value on the balance sheet. | |
| (4) | The cumulative impact of changes in Citigroup’s own creditworthiness in valuing liabilities for which the fair value option has been elected, and own-credit valuation adjustments on derivatives, are excluded from Common Equity Tier 1 Capital, in accordance with the U.S. Basel III rules. | |
| (5) | Includes goodwill “embedded” in the valuation of significant common stock investments in unconsolidated financial institutions. | |
| (6) | Assets subject to 10% / 15% limitations include MSRs, DTAs arising from temporary differences and significant common stock investments in unconsolidated financial institutions. As of March 31, 2017, the deduction related only to DTAs arising from temporary differences that exceeded the 10% limitation. | |
| Appendix D | ||||||||||||
| ($ in millions) |
3/31/2018(1) |
12/31/2017 | 3/31/2017 | |||||||||
| Common Equity Tier 1 Capital (CET1) | $ | 144,127 | $ | 142,822 | $ | 152,664 | ||||||
| Additional Tier 1 Capital (AT1)(2) | 19,350 | 19,555 | 19,791 | |||||||||
| Total Tier 1 Capital (T1C) (CET1 + AT1) | $ | 163,477 | $ | 162,377 | $ | 172,455 | ||||||
| Total Leverage Exposure (TLE) | $ | 2,437,858 | $ | 2,432,491 | $ | 2,372,177 | ||||||
| Supplementary Leverage Ratio (T1C / TLE) | 6.7 | % | 6.7 | % | 7.3 | % | ||||||
|
(1) |
Preliminary. |
|
| (2) | Additional Tier 1 Capital primarily includes qualifying noncumulative perpetual preferred stock and qualifying trust preferred securities. | |
| Appendix E | ||||||||||
| ($ and shares in millions, except per share amounts) |
3/31/2018(1) |
12/31/2017 | 3/31/2017 | |||||||
| Total Citigroup Stockholders' Equity | $ | 201,915 | $ | 200,740 | $ | 227,976 | ||||
| Less: Preferred Stock | 19,156 | 19,253 | 19,253 | |||||||
| Common Stockholders' Equity | $ | 182,759 | $ | 181,487 | $ | 208,723 | ||||
| Less: | ||||||||||
| Goodwill | 22,659 | 22,256 | 22,265 | |||||||
| Intangible Assets (other than MSRs) | 4,450 | 4,588 | 5,013 | |||||||
| Goodwill and Identifiable Intangible Assets (other than MSRs) Related to Assets Held-for-Sale | 48 | 32 | 48 | |||||||
| Tangible Common Equity (TCE) | $ | 155,602 | $ | 154,611 | $ | 181,397 | ||||
| Common Shares Outstanding (CSO) | 2,550 | 2,570 | 2,753 | |||||||
| Tangible Book Value Per Share (TCE / CSO) | $ | 61.02 | $ | 60.16 | $ | 65.88 | ||||
| (1) Preliminary. | ||||||||||
| ___________________________________ |
| 1 Citigroup’s total expenses divided by total revenues. |
| 2 Preliminary. Citigroup’s return on average tangible common equity (RoTCE) is a non-GAAP financial measure. RoTCE represents annualized net income available to common shareholders as a percentage of average tangible common equity (TCE). For the components of the calculation, see Appendix A. |
| 3 Preliminary. Citigroup’s Common Equity Tier 1 (CET1) Capital ratio and Supplementary Leverage Ratio (SLR) reflect full implementation of the U.S. Basel III rules. For the composition of Citigroup’s CET1 Capital and ratio, see Appendix C. For the composition of Citigroup’s SLR, see Appendix D. |
| 4 Citigroup’s payout ratio is the sum of common dividends and common share repurchases divided by net income available to common shareholders. For the components of the calculation, see Appendix A. |
| 5 Citigroup’s tangible book value per share is a non-GAAP financial measure. For a reconciliation of this measure to reported results, see Appendix E. |
| 6 4Q’17 includes the $22.6 billion impact of the enactment of the Tax Cuts and Jobs Act (Tax Reform), which was signed into law on December 22, 2017. The final impact of Tax Reform may differ from these estimates, due to, among other things, changes in assumptions made by Citigroup and additional guidance that may be issued by the U.S. Department of Treasury. |
| 7 Results of operations excluding the impact of foreign exchange translation (constant dollar basis) are non-GAAP financial measures. For a reconciliation of these measures to reported results, see Appendix B. |
| 8 Citigroup’s CET1 Capital ratio and SLR reflect full implementation of the U.S. Basel III rules for all periods. As of December 31, 2017 and for all prior periods, these ratios are non-GAAP financial measures, which reflect full implementation of regulatory capital adjustments and deductions prior to the effective date of January 1, 2018. For the composition of Citigroup’s CET1 Capital and ratio, see Appendix C. For the composition of Citigroup’s SLR, see Appendix D. |
| 9 The pre-tax gain on sale of the Hilton portfolio in 1Q’18 was $150 million, partially offset by the loss of operating revenues for a net year-over-year impact of approximately $120 million. |
| 10 Credit derivatives are used to economically hedge a portion of the corporate loan portfolio that includes both accrual loans and loans at fair value. Gains / (losses) on loan hedges includes the mark-to-market on the credit derivatives and the mark-to-market on the loans in the portfolio that are at fair value. The fixed premium costs of these hedges are netted against the corporate lending revenues to reflect the cost of credit protection. Citigroup’s results of operations excluding the impact of gains / (losses) on loan hedges are non-GAAP financial measures. |
